Landsat : Some of its history and its future
by Paul Wise, February 2023
Introduction
Almost without any fanfare Landsat 9 was launched on 27 September 2021 from Space Launch Complex 3E at the Vandenberg Space Force Base on an Atlas V 401 launch vehicle. In February 2022, its data became available to users.
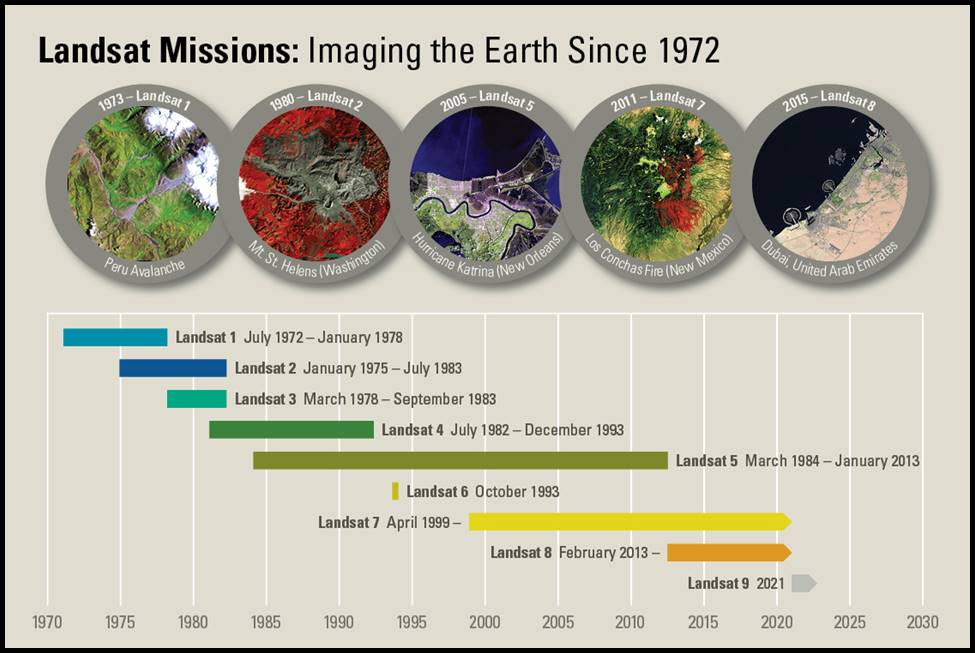
As Landsat 6 was lost on launch, Landsat 9 became the eighth satellite of the series to provide continuity of world wide, earth observation data. Below, from https://www.usgs.gov/landsat-missions/landsat-satellite-missions, is a diagram showing the Landsat satellite series.
Landsat path/row scene coverage of Australia may still be determined from this map.
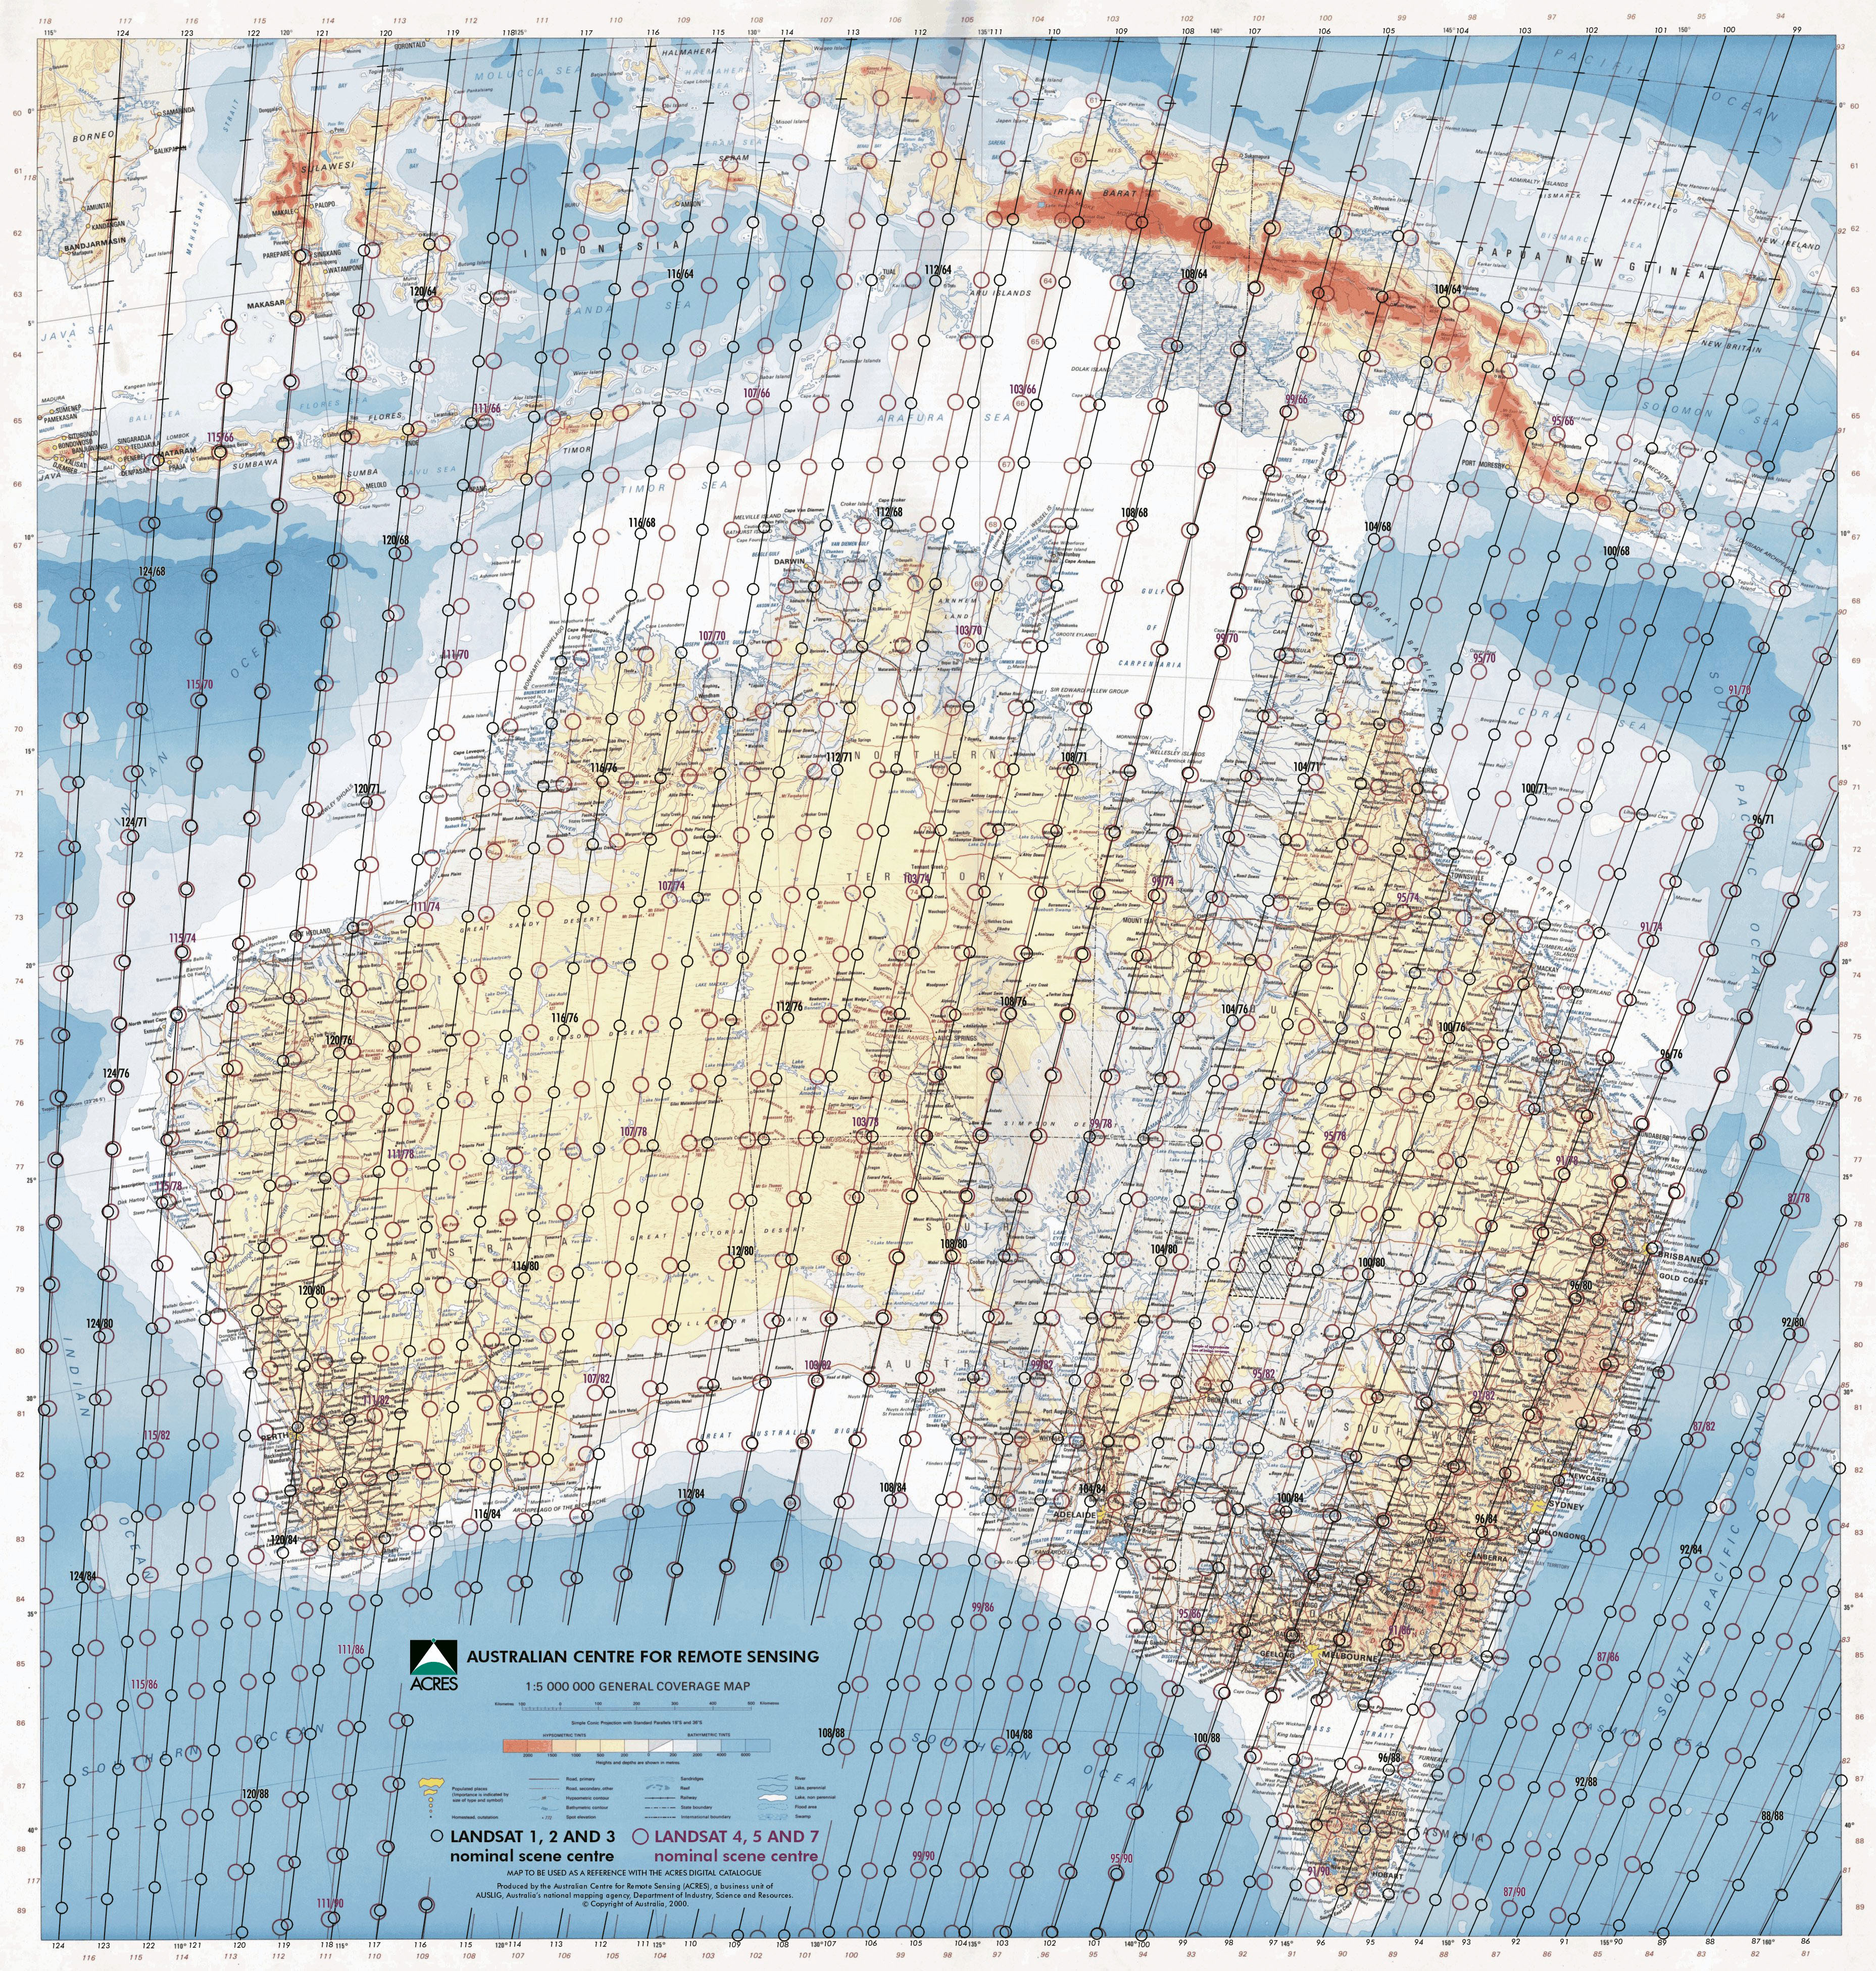
Since the earliest days of the Landsat program, Australia has had an intense interest in the program’s data. This paper covers some of Landsat’s history and describes the future of the Landsat program.
Capability Landsat’s 1-9
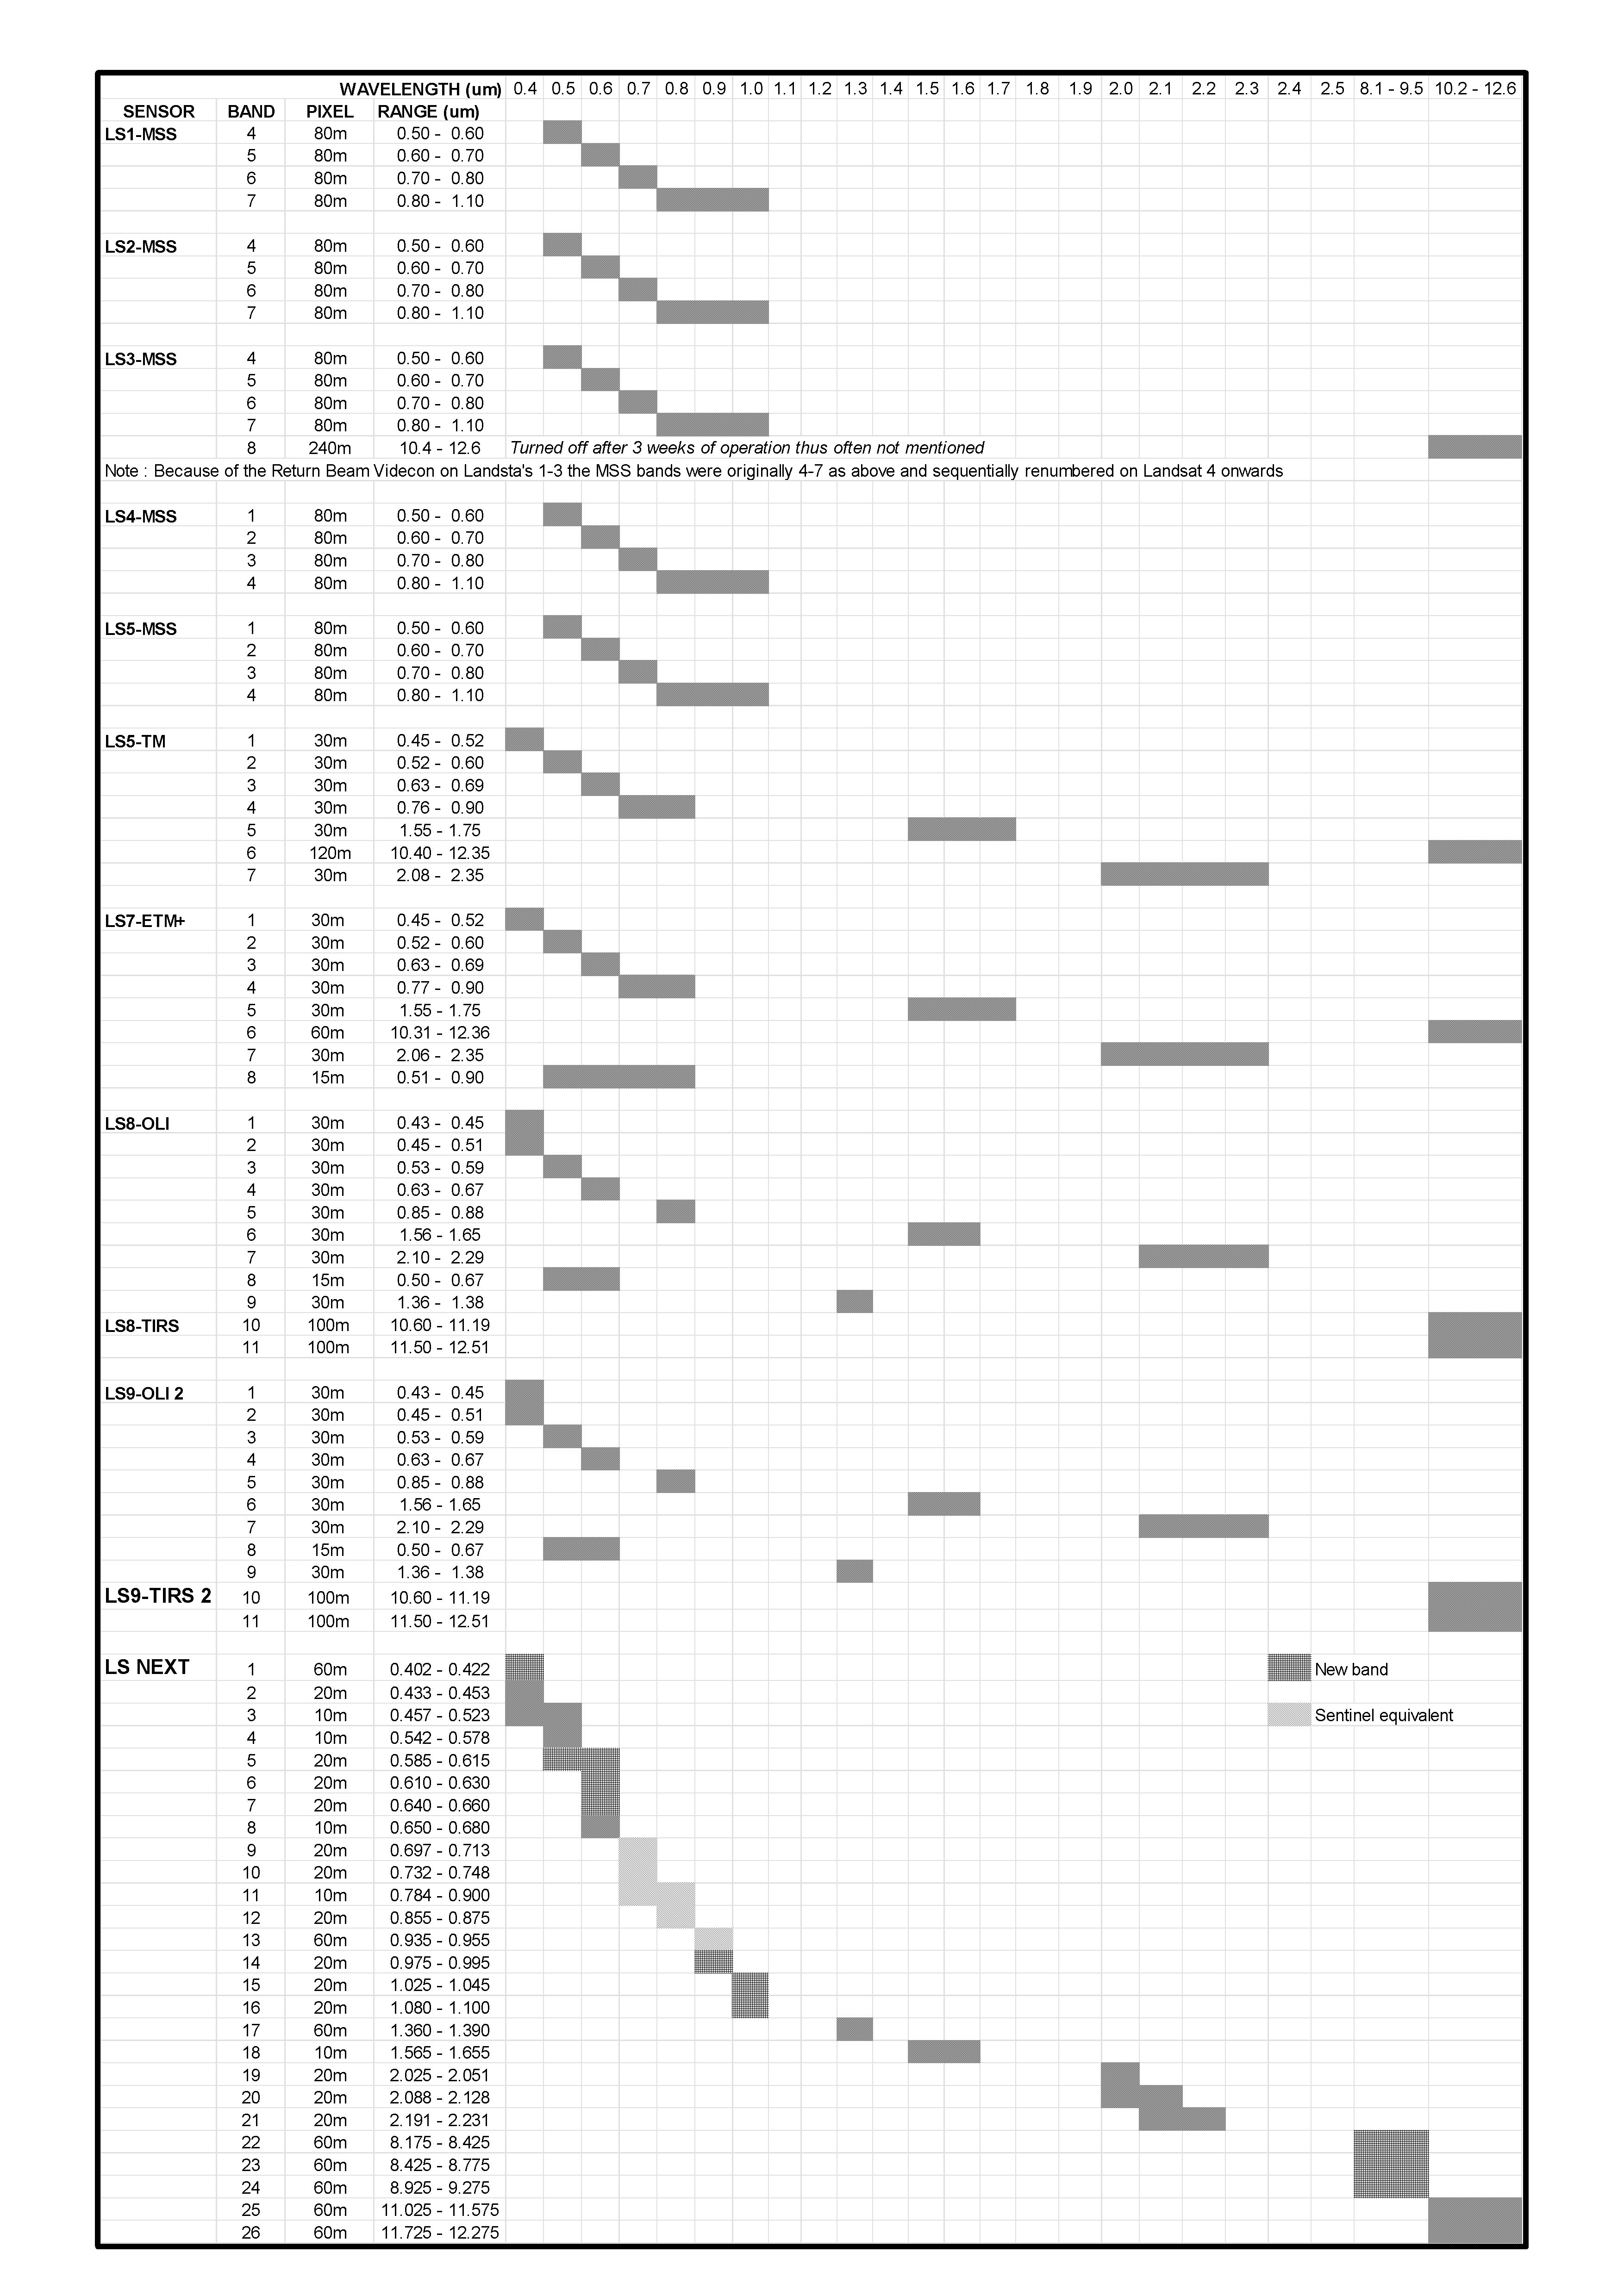
This table summarises the capabilities of Landsat’s 1-9 in terms of their sensor characteristics. Also included are the sensor characteristics for the next satellite of the series, which is currently termed Landsat Next. More detail is given below.
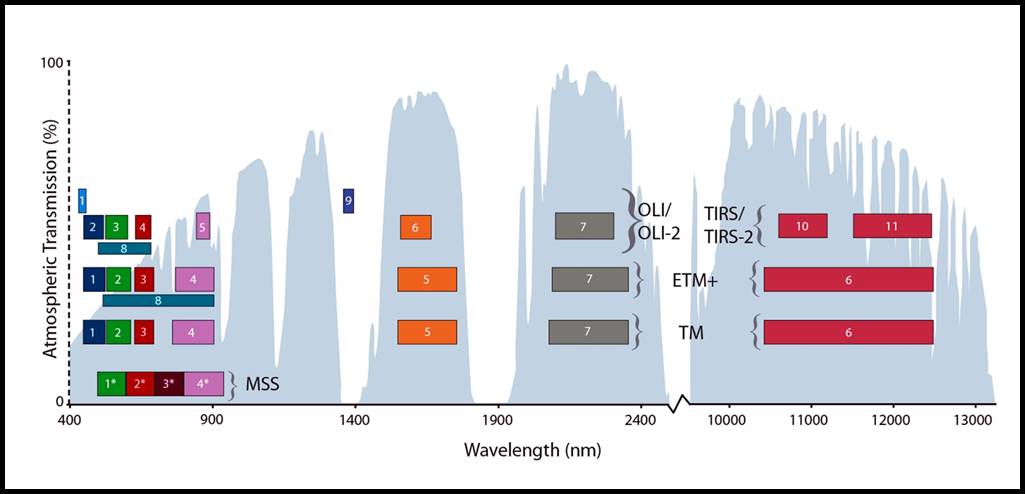
Diagram showing Landsat’s 1-9 sensors, spectral channels and band-passes, superimposed on atmospheric transmission percentage (grey background)
(Courtesy : https://landsat.gsfc.nasa.gov/satellites/landsat-9/landsat-9-instruments/landsat-9-spectral-specifications/)
The diagram above is another view of Landsat’s sensors, spectral channels and band-passes. Starting with the Multi Spectral Scanner (MSS) at the bottom carried onboard Landsat’s 1 to 5 (noting that the 240 metre thermal band on Landsat 3 is not shown as it was turned off within three weeks of launch); then the Thematic Mapper (TM) of Landsat’s 4 and 5; the Enhanced Thematic Mapper Plus (ETM+) of Landsat-7; and top are Operational Land Imager (OLI) and Thermal Infra Red Sensor (TIRS) of Landsat’s 8 and 9.
For the record, the four bands of MSS shown as 1, 2, 3, 4 in the diagram above were originally designated bands 4, 5, 6, 7 on Landsat’s 1-3. The numbering was changed from Landsat 4 onwards. Landsat’s 1-3 carried an instrument called the Return Beam Videcon (RBV) whose three bands were designated 1, 2, 3. The Return Beam Vidicon sensor utilised vidicon tube instruments containing an electron gun that read images from a photoconductive faceplate similar to television cameras. The data stream received from the satellite was analogue-to-digital preprocessed to correct for radiometric and geometric errors. The images were subsequently stored on 70 millimetre monochrome film and digital copies of these images are still available today. While the RBV was supposed to be the premier instrument the spectacular results obtained by the MSS saw the RBV phased out.
When launched in 1972, the Earth Resources Technology Satellite (ERTS 1), was primarily a military satellite. Around the time of the launch of the second satellite of the series, the name was changed to Landsat 2 (Land Satellite 2), thus ERTS 1 became Landsat 1. The Landsat sequence was as follows :
Landsat 1 : July 1972 to January 1978 (5.5 years)
Landsat 2 : January 1975 to July 1983 (8.5 years)
Landsat 3 : March 1978 to September 1983 (5.5 years)
Landsat 4 : July 1982 to December 1993 (11.5 years)
Landsat 5 : March 1984 to January 2013 (29 years)
Landsat 7 : April 1999 ongoing (some 23 years)
Landsat 8 : February 2013 ongoing (some 10 years)
Landsat 9 : September 2021 ongoing (over 1 year)
Informative videos re Landsat 9 :
Earth Resources Technology Satellite (Landsat 1), NASA, 1973 : https://www.youtube.com/watch?v=PujwzXGj28c
A Trip Through Time With Landsat 9, NASA : https://www.youtube.com/watch?v=up9oDz49QXI
9 Things About Landsat 9, NASA : https://www.youtube.com/watch?v=DGE-N8_LQBo
The 2013 launch of Landsat 8 was followed by the launch of Sentinel 2A and 2B in 2015 and 2017, respectively. The Sentinel series of satellites form part of Copernicus, the Earth observation component of the European Union Space Programme, managed by the European Commission. When Sentinel 2C is launched in 2024, the Sentinel 2 constellation will consist of three satellites. The Sentinel sensors may be considered as Landsat lookalikes and currently by obtaining data from Landsat 8, Sentinel 2A, and Sentinel 2B the revisit cycle for a site is just under 3 days.
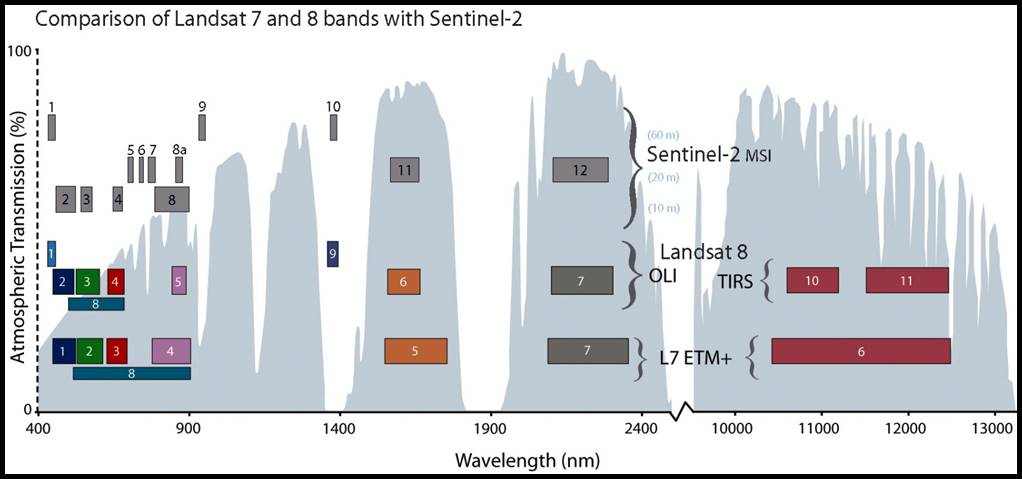
Diagram showing Sentinel 2 along with Landsat’s 7 & 8 sensors, spectral channels and band-passes, superimposed on atmospheric transmission percentage (grey background)
(Courtesy : https://landsat.gsfc.nasa.gov/satellites/landsat-9/landsat-9-instruments/landsat-9-spectral-specifications/)
Landsat’s 8 and 9 provide a revisit capability of 8 days and when added to the availability of Sentinel data a site may be revisited every 2.3 days.
Further detail on Landsat in Australia is contained in the following :
A Short History of Landsat MSS by Mike Linney & Paul Wise, first published in ACRES Update, Issue 16, March 1998; and
MSS : A great beginning with no end in sight! by Dean Graetz, CSIRO Earth Observation Centre, both available at the Annex.
An interview with Dean Graetz (by Catherine Rayner) may be read here.
A History of Satellite-based Remote Sensing in Australia : 1970-1989 by Catherine Rayner, a narrative which formed part of her thesis successfully submitted for the Degree of Master of Philosophy of The Australian National University. Catherine's permission to reproduce her narrative is appreciated and copyright conditions apply.
Landsat Next
What is currently known as Landsat Next is planned for launch in late 2030. Landsat Next will be a trio of smaller superspectral observatories that can each detect 26 wavelengths of light and thermal energy. The three satellites will be injected into orbit aboard the same launch vehicle.
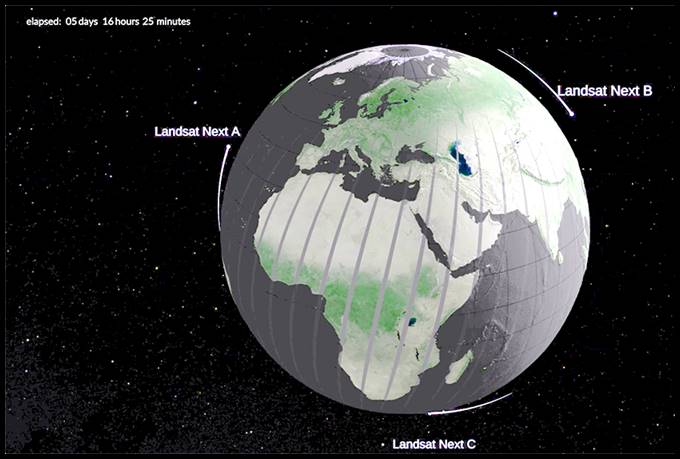
Depiction of the Landsat Next trio of satellites enabling a revisit cycle of 5 days 16 hours 25 minutes.
The 26 spectral bands of Landsat Next includes refined versions of the 11 Landsat heritage bands of Landsat’s 8 and 9, five bands with similar spatial and spectral characteristics to the European Space Agency’s Copernicus Sentinel-2 bands to allow easier merging of data products, and ten new spectral bands to support emerging Landsat applications. On their own the constellation will permit a revisit cycle of 5.684 days and even less when data from Landsat’s 8 and 9 and Sentinel 2 are considered.
The heritage bands of Landsat Next will be 2, 3, 4, 8, 17, 18, 19, 20, 21, 25 and 26. The Sentinel 2 equivalent bands will be 9, 10, 11, 12 and 13 leaving bands 1, 5, 6, 7, 14, 15, 16, 22, 23 and 24 as the new bands. The following diagram shows the relationship of Landsat Next’s proposed spectral bands to those of Landsat’s 8 and 9. Pixel sizes will be nominally 10, 20 and 60 metres. This table again provides the relationship between band and pixel size.
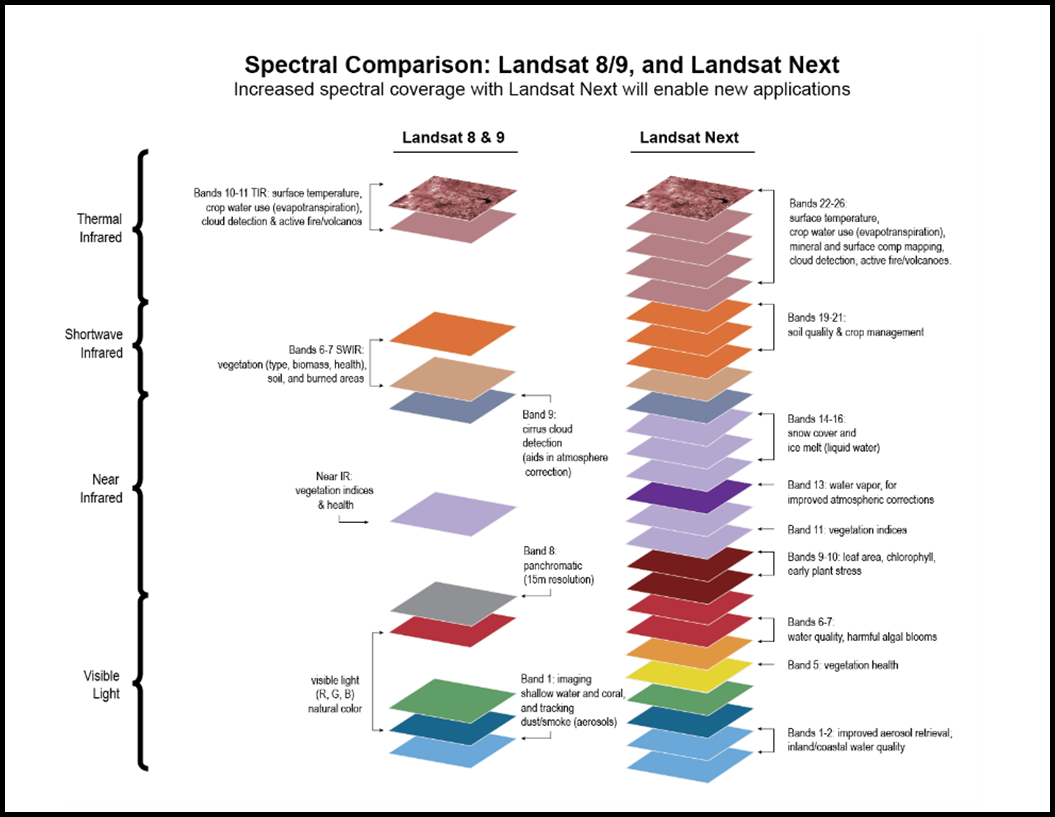
The Landsat Next 10 and 20 metre pixel sizes will permit easier band integration with SPOT data and three of the new thermal bands will continue data collection similar to that of the ASTER (Advanced Spaceborne Thermal Emission and Reflection) of Terra, the first Earth Observing System (EOS) satellite.
Satellite Remote Sensing Matures
The last 20 years of the 20th century saw operators of new satellites competing for use of their data. The first 20 years of the 21st century has seen satellite operators realising that by meshing their data with that existing and/or already ongoing they can invite use of their data. By decreasing revisit times to a site by having the orbital characteristics of their satellite(s) synchronised to be overhead when other satellites are elsewhere means a user wanting rapid site monitoring can select data from several satellite operators to archive that aim. Also by having their satellite(s) fitted with sensors with the same/similar spectral range and resolution adds to the archive of data for a site allowing for temporal analysis over a longer period but with shorter intervals. This changed and somewhat enlightened approach appears to indicate a maturing of the industry – cooperation rather than competition.
A Short History of Landsat MSS
by Mike Linney & Paul Wise, first published in ACRES Update, Issue 16, March 1998
Introduction
The Multi-Spectral Scanner (MSS) technology carried on board the United States Landsat series of satellites, one through five, gave users of its data a regular view of the earth never available before. ACRES estimates that over the 17 years of MSS data collection, in excess of 309 000 MSS scenes have been archived with the most popular eras being that of Landsat’s 2 and 5.
Launch Dates and Satellite Service
While the first Landsat satellite (then called ERTS for Earth Technology Resources Satellite) was launched in 1972, ACRES did not directly downlink data into Australia until 1979. The following table summarises the launch dates and satellite service periods for Landsat.
Landsat 1 : July 1972 to January 1978 (5.5 years)
Landsat 2 : January 1975 to February 1982 (7 years)
Landsat 3 : March 1978 to March 1983 (5 years)
Landsat 4 : July 16 1982 to July 1988 (6 years)
Landsat 5 : March 1 1984 to 1998 (13+ years)
The first MSS dataset that ACRES has in its archive is path 106, acquired 14 September 1979, from Landsat 2. This path is similar to the current Landsat 5 path 99 which covers a swath through the Gulf, down the east side of Alice Springs, over the Simpson Desert, Lake Eyre North and out over Port Lincoln. The last MSS dataset is path 108, acquired from Landsat 5, at the end of November 1997. This path covers the swath from Cape Londonderry to Esperance through the Great Sandy, Gibson and Great Victoria Desserts.
At the time of termination, Australia was the only country still receiving MSS routinely, all other ground stations having terminated MSS downlinks several years previously. This conscious effort on ACRES part to provide continued access to the MSS dataset was driven by the value it saw in having a useful long term archive for the national good.
Landsat 1
Landsat 1, which was launched in July 1972, was immediately used in the first phase of Resources Survey program. NASA's first manned space station Skylab and NASA aircraft were teamed up with selected Landsat passes to obtain supplementary information on the spectral signatures of ground features. This helped in the location of new energy sources and improved geological mapping techniques, and to determine which data could be most effectively and economically obtained via manned or unmanned service satellites and instrument subsystems.
Due to electrical malfunctions and power budgeting that first year, the three Return Beam Vidicon (RBV) cameras and one of the Wide Band Video tape recorders, needed for acquiring images outside of North America, were deactivated. The rest of the payload functioned normally until 29 March 1973.
The second tape recorder then malfunctioned, causing image coverage of the rest of the world outside the United States and Canada to be reduced to those countries with United States Tracking Stations. Australia had the tracking capabilities through the antennae set up for the early Mercury, Gemini, Apollo and Skylab manned missions and continued to supply NASA with recorded real time image data on a small scale.
ERTS 1, primarily a military satellite, was renamed to Landsat 1 (Land Satellite 1) and released to allow world access to its data as a Scientific and Land Management Remote Sensing tool. It went full term, providing data routinely for six years, until its instruments finally began to deteriorate the worst of which was a sensor failure in the last year of operation. Transmission was finally terminated in January 1978.
Landsat 2
Landsat 2 was launched in January 1975 and, since Landsat 1 had far exceeded expectations as an experimental scientific earth resources tool, potential rewards were estimated in the billions of dollars annually. This cut costs by 1/20th to industry, commerce and government, complementing the data collection from Landsat 1, and resuming world coverage through wide band video tape recording and playback. Landsat 2 performed as expected but began to suffer degradation of the solar power panel arrays after about four years in orbit placing some limitations on the amount of data available. This was followed some time later by intermittent attitude control problems, which affected both the geometry and availability of the data. Nevertheless, it continued to provide significant amounts of data as a backup satellite for Landsat 3 until it was taken out of service in July 1983 with a frozen yaw wheel.
Landsat 3
Landsat 3 was launched in March 1978 but after the first year of operation it developed faults in the onboard electronics system. This resulted in the intermittent loss of about 28% of data on the western side of the path.
The problem, known as late line start, required groundstations to develop special software to recover the remainder of the data. Switching between backup systems on board the satellite gave extended periods of proper operation over the next year. However, by the beginning of 1982 the fault could not be overcome and further degradation to the MSS data stream started to become evident. First the end of line code then the beginning of line code failed. Landsat 2 was brought back into service to help support the ailing Landsat 3 spacecraft acquire world coverage until Landsat 2 failed. Landsat 3 was taken out of service in September 1983.
Landsat 4
Landsat 4, launched in July 1982, soon experienced power faults and the eventual loss of two solar arrays due to thermal stress on the power cables from the array panels. The remaining solar panels were offset to minimise cable stress as the loss of these cables would have shutdown the satellite. By now the power restrictions and other electronic failures had resulted in the Landsat 4 data downlink contaminated with coherent noise effecting the image data, a situation that was never resolved. Operations continued as a backup to Landsat 5, after its launch, but Landsat 4 was eventually released from services in July 1988.
Landsat 5
Landsat 5 was launched in March 1984. The deployment of Landsat 5 was earlier than planned due to the failures with Landsat 4. Nevertheless, apart from the failure of the S band telemetry antenna in May 1990 and some faults and failures that had been covered by redundant electronics the most significant recent problem was the total failure of MSS band 4 on the 29 April 1994. Landsat 5 has been the most successful and reliable satellite yet in the Landsat series and is alive and well and celebrated its thirteenth birthday on 1 March 1997. Recent reports from the operator indicate that it may last beyond 2000, if required.
After MSS
The Thematic Mapper (TM) sensor and the newer Enhanced Thematic Mapper (ETM) sensor became the technological followers to MSS. Landsat 6 (RIP wherever you are) and its successor, Landsat 7, due for launch mid 1998, did/do not have MSS capability. MSS technology will cease with the demise of Landsat 5.
Conclusion
As a whole, the Landsat series of satellites have been very successful. With the exception of Landsat 6, all the satellites have well exceeded their three year design life. Failures have however impacted on the quality of the MSS data, especially from Landsat’s 3 and 4. MSS datasets from Landsat 2 in conjunction with recent acquisitions from Landsat 5 have provided Australia with an unprecedented opportunity to determine environmental change during the 70s, 80s and 90s. This valuable data archive has proven to be an important tool in understanding Australia's natural history.
Vale MSS!
Landsat 5 MSS Data Acquisition Ceases
ACRES acquired, archived and processed Landsat 5 MSS data up until 30 November 1997.
Since 1989 these acquisitions have largely been duplicated by the more popular and universal Landsat 5 TM coverage. ACRES has carefully safeguarded all its existing 17 years (1979 to 1997) of MSS data on optical tape and will maintain an ongoing capability to process these data.
MSS : A great beginning with no end in sight!
Dean Graetz, CSIRO Earth Observation Centre
I write to praise the MSS, not to farewell it. The good that instruments do (their data archives) lives after them. Their inadequacies are soon forgotten. This is my personal reflection on the recent termination of the MSS data stream.
I was privileged to have been involved with MSS data from the beginning. I joined CSIRO in 1972 and one of my first tasks was to attend a national briefing on the soon to be launched Earth Resources Technology Satellite (ERTS).
In 1972, CSIRO was heavily committed to remote sensing research. The effort was focussed in the geo-sciences by Dr Ken McCracken, then Chief of the Division of Mineral Physics. Ken and his staff had proactively organised a national meeting in anticipation of ERTS 1 that was open to all potential users. My memory was of a crowd of more than 500 excited but bewildered exploration, foresters, agronomists and other assorted professional strays. We had no actual data at that time but could work hands on with multispectral photography from NASA and CSIRO. A summary of our collective reaction was 'Wow!'
That was July 1972. By early 1973, the first photographic products of Australian imagery became available and satellite based, remote sensing began. It was taken up by many groups in many locations using a variety of innovative techniques. All products were analogue; digital data was yet to arrive.
The 1970s were an exciting decade. There were many involved groups, from almost every state agency, and there were some colourful, feral characters about. Overall, the applications projects were imaginative and exciting. Satellite images were everywhere. I do not exaggerate when I say that MSS data changed my life. In a small rural town on a leisurely February morning in 1973, I opened a small parcel and help up to the light a 1: 1 000 000 scale monochrome film positive of WRS [path/row] 102_082, the Broken Hill scene. The information that I could extract from this simplest of product was staggering. As a rangelands ecologist, I was instantly empowered. I've never forgotten the excitement of that beginning; never. Twenty five years later, I still get a great kick from working with satellite data and take pleasure in introducing it to others.
In the beginning, access to MSS data was not well organised and painfully slow. Much was happening. The quite severe (ENSO - El Niño and the Southern Oscillation) drought of 1969-1972 gave way to the unprecedented wet period of 1973-1974, which was in turn followed by the widespread wildfires of 1975-1976. Much of this was captured by the then renamed Landsat’s 1 & 2. The three channel Return Beam Vidicon (RBV) data stream from these craft was discontinued and the Multispectral Scanner (MSS) became the workhorse but still retaining the odd channel nomenclature MSS4, MSS5, etc. MSS data was the only data for 12 years until the arrival of Landsat TM about 1984.
So what have been the contributions of MSS data?
I see these three contributions - all equally important.
First : because MSS data was the first widely available set, it was the one that catalysed the application of satellite remote sensing to both problems and solutions. MSS data sparked the continuing process of sensitising Australian society to the intrinsic nature of the Australian continent and the consequences of its use of the land and water resources. I cannot believe that the current high level of environmental understanding and responsibility could have arisen without MSS data and associated tribe of enthusiastic proponents. Moreover, this high level of understanding and appreciation is most unlikely to diminish in the future. The activities and consequences of renewable resource management agencies, public and private, are open to the scrutiny of all. Competence can be applauded and ineptitude dealt with. From 1972 onwards, there was no place to hide!
Second : MSS data fostered new and exciting areas of applications research. Prospective applicants of MSS data were forced to reconcile the unusual spectral and spatial dimensions of the data which came in digital rather than analogue form. In the spectral domain, the tangible world was captured in just four broad wavebands, two of which had no visual equivalent. Whatever analogue product resulted, it was always a false colour composite. From this flowed the slow realisation by plant and soil scientists that their familiar and complex world could be simply captured in just two spectral dimensions, the red and near IR [Infra Red] and that simple indices based on the geometry of this 2D spectral space, such as the legendary NDVI, could be extremely powerful. Graph paper and simple texts on PCAs became best sellers overnight. Statisticians suddenly found new friends who bought them beers and asked about MLC and the advisability of CVA. People muttered and wrote about scene modelling.
The spatial domain of MSS data, i.e.. pixels of approximate area 1 ha, was less successful in forcing a revolution in applications thinking. A few, and I count myself in, accepted the universal reality of mixels and explored the pathways of mixture modelling. For this group, understanding the yet to arrive AVHRR data would not be a problem. Unfortunately, the majority of players retained a deep yearning for the high spatial resolution of air photography and flocked to Landsat Thematic Mapper (TM) data searching for the pure pixels to feed their MLC programs. This group are presently poised to flock again and roost on the newly promised 1-5m resolution data. I wish them well - farewell!
Third : there is now an archive of MSS data for the Australian continent beginning late 1972 which, though episodic from 1972-1979, now spans 26 years. This timespan is of sufficient length to begin to address the long term issues of Climate Variability and resource management policies because it can be used to tell us what actually happened - not what individuals or agencies thought happened. Our collective understanding (intelligence) is constrained by the available information (extelligence). I cannot over emphasise the importance of an objectively acquired data archive. It is not just the Democrats who keep the bastards honest. Satellite data is far more effective.
To illustrate : I am currently using MSS to measure the rate of landcover clearing and regrowth for the entire continent during the 1980-1990 decade. These figures will support Australia's future negotiations within the United Nations Framework Convention on Climate Change. There are no other measurements of clearing - only expert opinion - and such opinion usually has a hard time in a court of law.
Mike Linney and Paul Wise end their informative history with the words Vale MSS. The MSS instrument is dead but its data lives on and that archive can be seamlessly integrated with that which follows. From now on, if necessary, it is possible to constitute MSS data from TM. SPOT and IRS data are MSS lookalikes.
I suggest that the contribution of MSS will never die. It will live on as the principal foundation of earth observation understanding that is held, refined and transmitted by current practitioners. MSS data spawned the first national remote sensing conference (1979) that continues now as an international event. MSS data, as large prints on walls and in magazines irrevocably changed Australian's view of their own continent. Remotely sensed data is now regularly accepted as evidence in courts of law.
Above all else, I remember that it was MSS data which catalysed remote sensing, and that it was remote sensing which supported a significant change in our national environmental perception and values. Personally, I have no doubt that this change has been for the better. Of this I am sure because by chance, I was privileged to play a part in that change.
So, Rock on Remote Sensing!!