LASER TERRAIN PROFILER
1. INTRODUCTION
National Mapping is currently engaged on the compilation of contoured maps throughout Australia at scales of 1:100 000 and 1:250 000 and has used the Laser Terrain Profiler to establish closely spaced network of elevations within the primary network of the Australian Levelling Survey. The elevations determined are used for vertical control to level stereoscopic pairs of aerial photographs in photogrammetric plotters.
The profiler is airborne and comprises a laser distance measuring system, a barometric reference unit to establish the height datum, a special continuous‑strip 70 mm camera to record the track, gyroscopes to sense the attitude of the aircraft, and associated support equipment, including paper roll recorder for displaying all relevant data.
2. OPERATIONAL CONFIGURATION
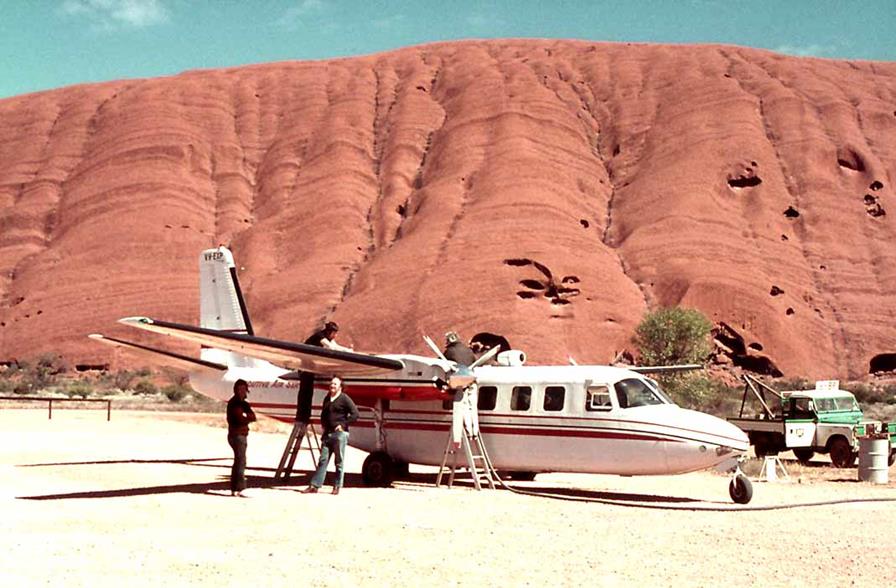
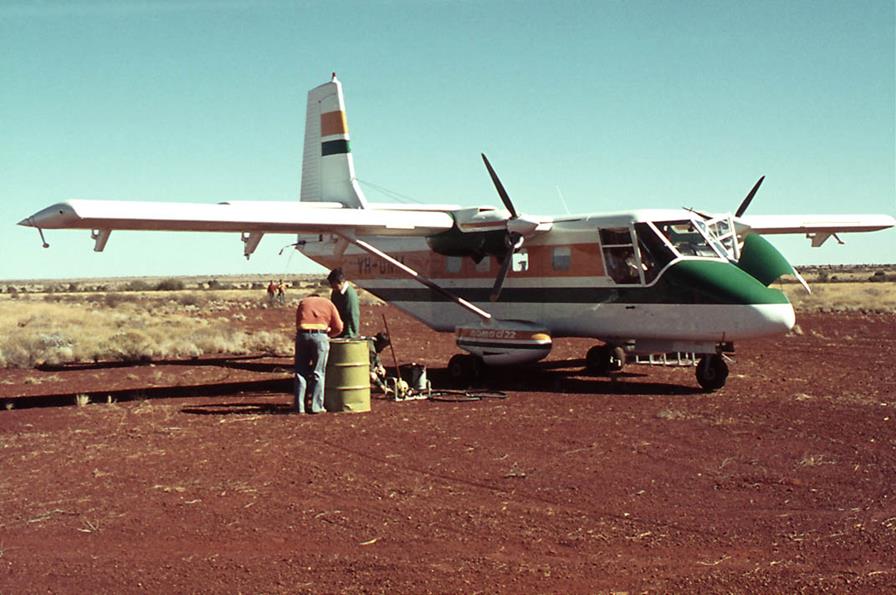
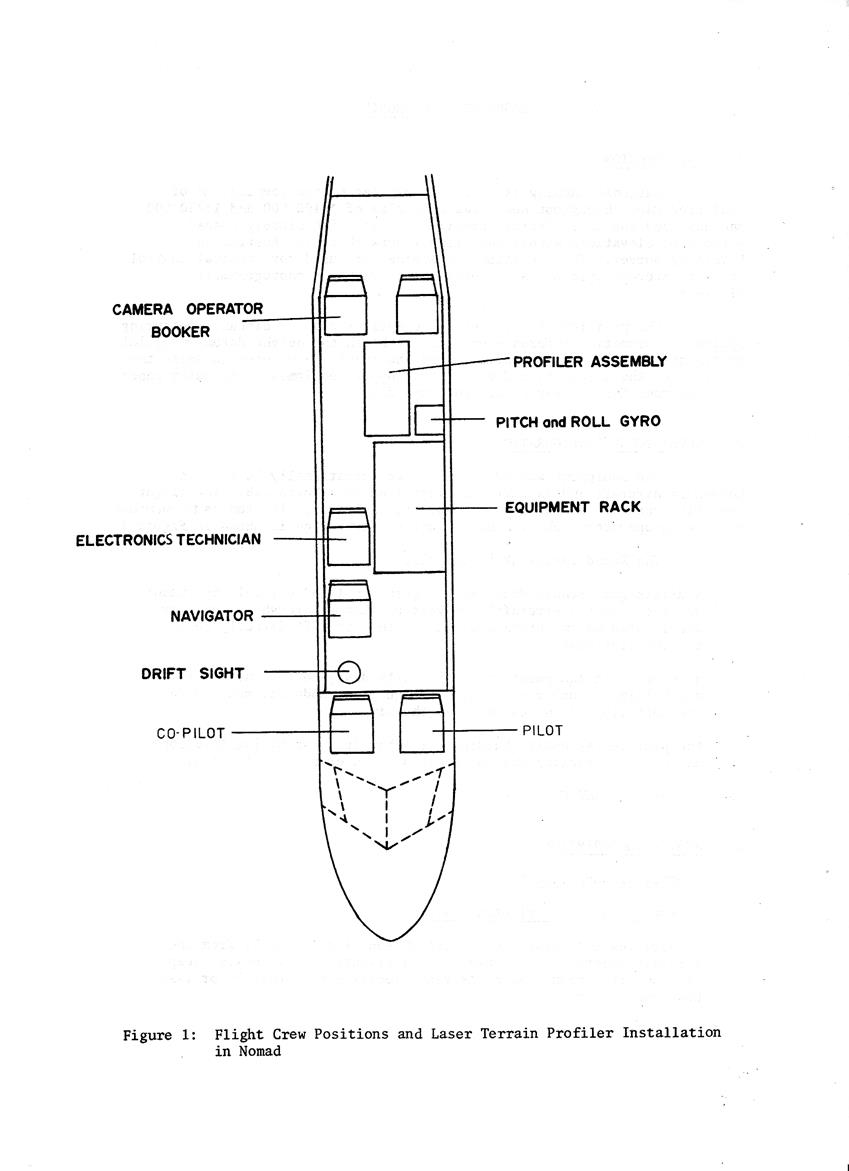
The equipment was originally used operationally in an Aero Commander aircraft and is currently installed in a Nomad 22B. The flight operation requires a crew of four: pilot, navigator, electronics technician and camera operator/booker. The typical configuration is shown in Figure 1.
The Nomad installation comprises:
a driftsight, Bendix Model B3: a gyro stabilised optical instrument powered from the aircraft's 28 volt DC supply through an inverter and located on the starboard side of the aircraft directly behind the co‑pilot seat;
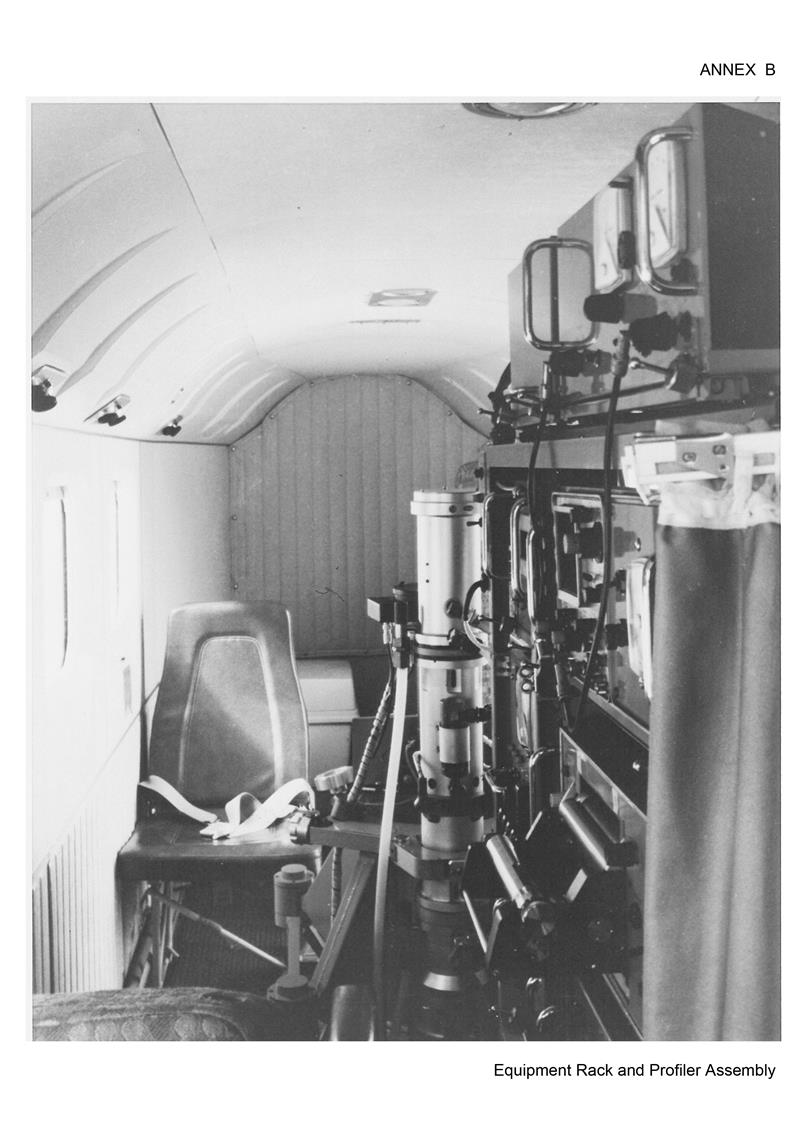
an electronic equipment rack, specially designed for the aircraft and holding a number of electronic equipment modules, mounted on the port side of the cabin under the wing;
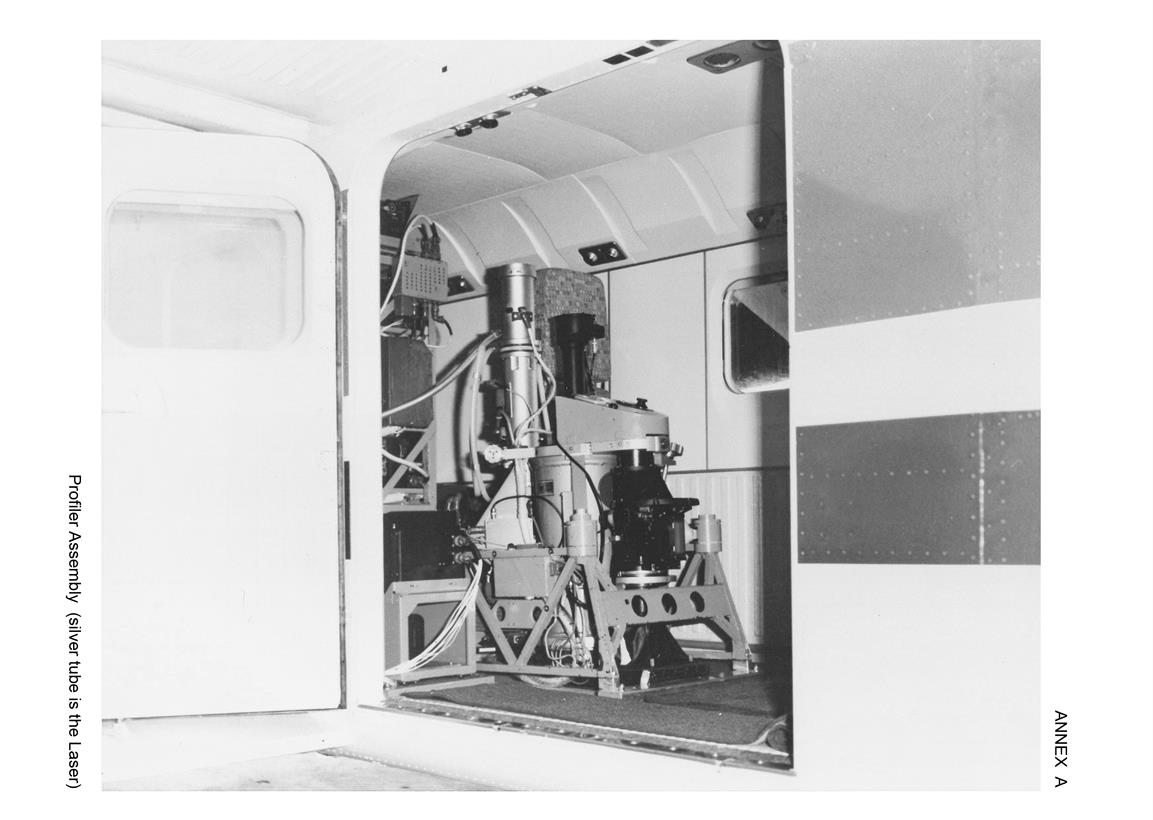
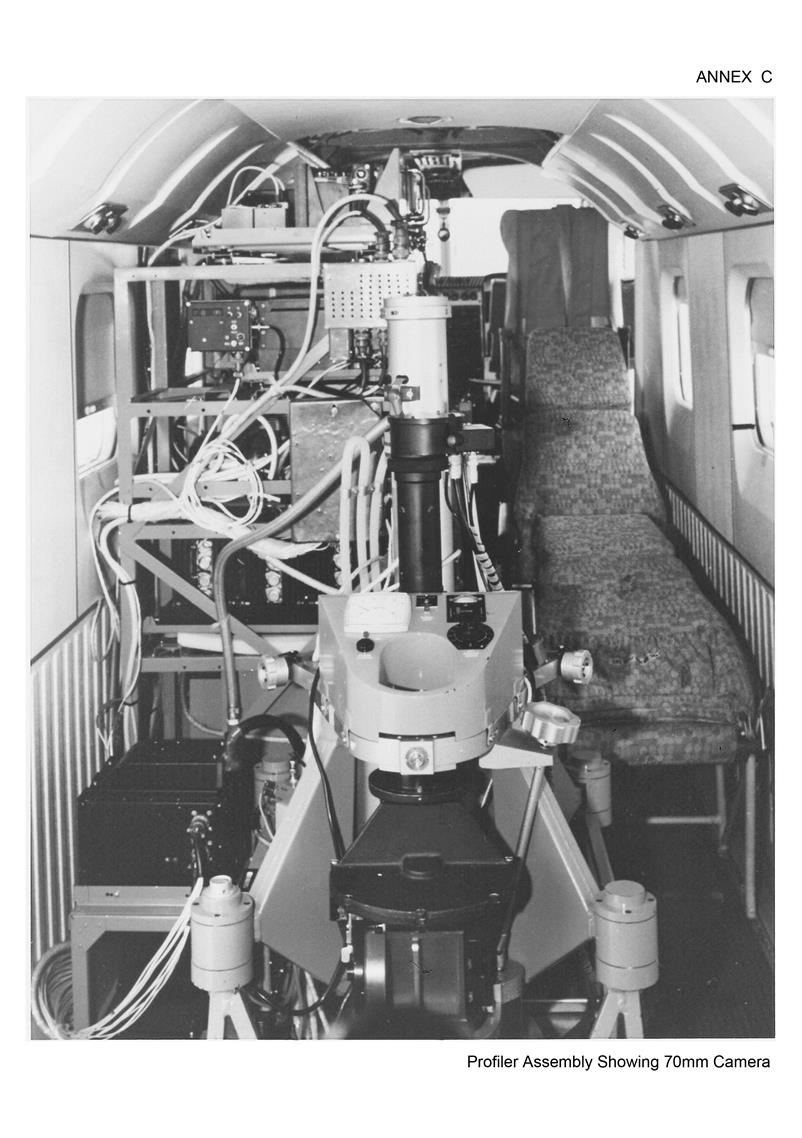
the profiler assembly, holding the laser tube, receiving telescope and a 70 mm tracking camera, located aft over a central hatch;
See Annexes A, B
and C.
3. SYSTEMS DESCRIPTION
Electrical Supply Unit
Power Supply Distribution Unit:
Receives two regulated 28 volt DC supplies (A and B) from the aircraft generators. Supply A is distributed to all units except the converter module which is fed directly from supply B for laser beam generation.
Laser Support Units
Converter Module:
Converts 28V DC from the aircraft to 250V DC for use by the laser.
Current Regulator:
Controls the laser current which can be varied from 11 amps to 18 amps, and provides starting circuits for the laser.
Water Module:
Circulates demineralised cooling water at a regulated flow and pressure to the laser and then via an air cooled head exchange on the top of the fuselage back to the holding tank. In addition, the return circuit contains a water head exchanger coupled to an external raw water supply for ground testing.
Vacuum Module:
Maintains laser vacuum and supplies argon gas for the laser discharge.
Receiver Support Unit
E.H.T. Supply:
Extra High Tension supply to the photo multiplier. It basically consists of a converter which provides a high voltage output for the photo multiplier tube.
Profiling Units
Laser:
The transmitter section contains a continuous‑wave argon ion laser and an electro‑optical modulator. The laser is energised by a DC are discharge maintained between anode and cathode and the light output is enhanced by an axial magnetic field. The laser provides a low divergent beam of light, concentrating most of the optical energy into a single spectral line of 4880 nm (blue‑green).
Receiver:
The photomultiplier detects the returning laser signal through a 2.54 metre focal length Cassegrain telescope. After filtering, it is amplified in the tuned‑head amplifier and fed to the height computer.
Height Computer:
Compares the phase of the reflected signal with the phase of the transmitted signal. The aircraft to ground distance can be measured on either a coarse scale or a fine scale using one of two modulated frequencies, 500 kHz or 3 MHz.
Calibrating the Height Computer establishes the relationship between chart movements and terrain clearance.
The profile trace automatically moves from one extremity to the other when the calibration setting is selected and thus defines the upper and lower limits of the trace.
In fine scale (3 MHz) this span is equivalent to 50 metres, and measuring between these extremes on the chart in millimetres, the exact ratio of terrain movement to chart movement is calculated; nominally 1 mm on the chart is equivalent to 0.5 m in terrain height.
In coarse scale (500 kHz) the span is equivalent to 300 metres and nominally 1 mm on the chart is equal to 3 m in terrain height.
The distance from the bottom of the chart to the lower extremity of this trace defines the zero of the profile trace. (see Annex D).
Barometric Reference Unit (BRU):
Records small changes in pressure by "capturing" a reference sample of air and continuously comparing the subsequent static air pressures while profiling. The variations are recorded as a continuous trace on the chart. The calibration facility is in the reference pressure capsule and appears as a pulse on the chart. The depth of this pulse is related via a graph of pressure tables at each altitude to give a nominal ratio: 1 mm is equivalent to about 0.6 m in aircraft height.
The distance from the bottom on the chart to the BRU trace just before calibration defines the BRU zero.
The Chart Breakout Sheet is used to compute the actual relationship ‑ see Annex D.
Pitch and Roll Gyroscopes:
The amount of aircraft movement from straight and level flight is indicated on the chart via the pitch and roll gyros. The variation in traces from the gyros on the profiling chart indicate places where heights may be suspect, i.e. laser beam not vertical and indicating false height.
Recording Units
Timing Generator:
A modified WRE TIM code generator comprising a timing unit which provides a coded sequence of pulses for continuous time reference. The digital display shows elapsed time in hours, minutes and seconds. An oscillator drives a chain of dividers to produce a binary coded decimal time code. The code is fed directly to the recorder and the tracking camera. See Annex E.
UV Recorder:
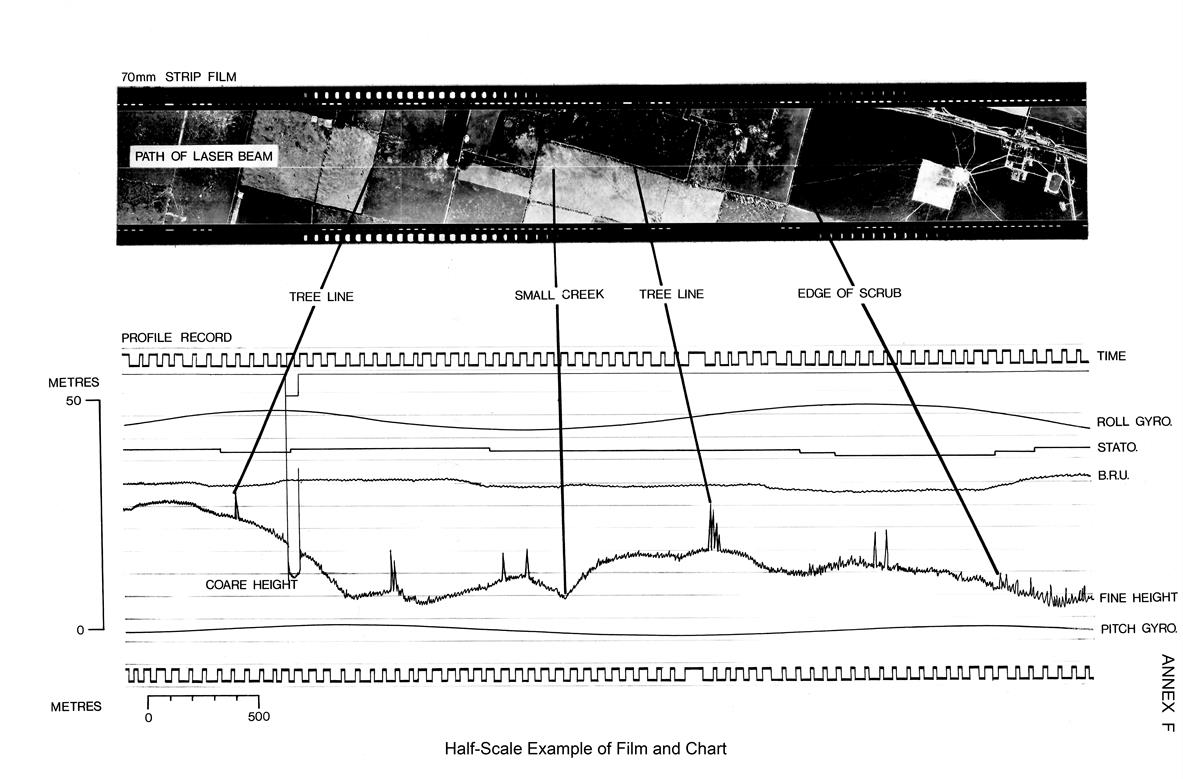
The function of the recorder is to record on ultra‑violet light-sensitive paper, using U/V light and galvanometers, the output of the height computer, barometric reference unit, gyros and timing unit. See Annex F.
Tracking Camera:
Photographs the ground track of the laser in strip form, on 70 mm film. The camera incorporates an 88.9 mm focal length Kodak "Aero Ektar” lens with a fixed aperture of f2.5. A partially transmitting mirror set at 45º to the lens axis reflects approximately half of the incoming light to the film set at the focal plane, just beyond a narrow slit. The remainder of the light is transmitted by the mirror to a ground glass screen where an image of the ground is formed. To ensure equal longitudinal and transverse film scales, the film transport speed must exactly match the ground image speed. A rotating glass disc with an engraved spiral is mounted directly above the screen in such a manner that when it rotates, the spiral appears as a set of parallel lines moving in the same direction as the image of the ground. The mechanical gearing between the film transport motor and the spiral disc is such that whenever these lines appear to move at the same speed as the image of the ground, the film transport speed is equal to that of the ground image on the slit. Drift angle can be measured, and compensated for, by rotating the camera until the ground image motion aligns with straight lines engraved on the viewing screen. This ensures that the slit is normal to the ground track thus producing an undistorted picture. Manual exposure control is achieved by a neutral density wedge positioned in front of the slit to compensate for film speed changes and varying light conditions.
Monitor and Testing Unit
Oscilloscope:
Used to monitor wave forms and provide visual display of the height computer outputs. Also used for general testing.
Automatic Pilot
Collins 3‑axis Model AP107:
A three‑axis auto pilot unit with height holding capability is essential to ensure the aircraft is maintained within a 50 metre vertical envelope at all times during profiling. It is not practical to fly the aircraft manually within this ±25 metres criteria throughout the usual 4 to 5 hour operational flight.
4. PRINCIPLE OF AIRBORNE PROFILING
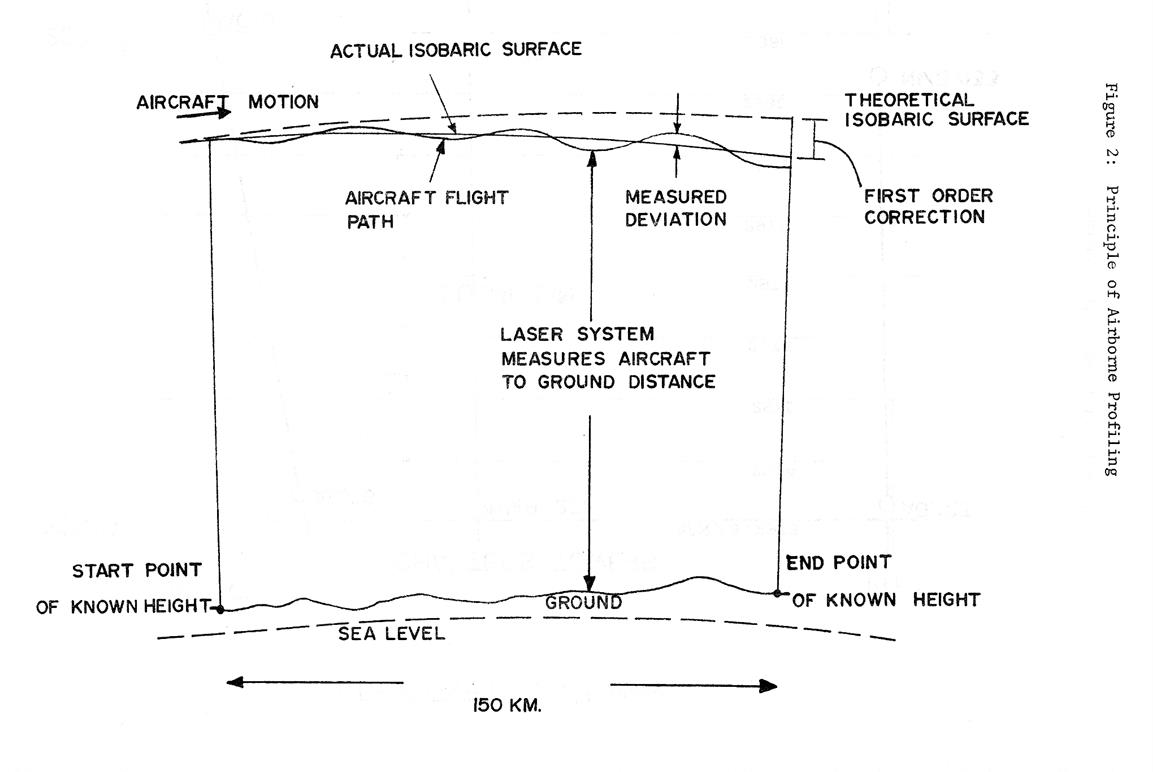
The distance between ground and aircraft is determined by comparing the phase of the transmitted and reflected laser light, which is continuously recorded on the ultra‑violet sensitive chart.
By flying over points of known elevation at the start and finish of each flight line and applying an accurate correction provided by the Barometric Reference Unit which continuously senses small changes in the flying height of the aircraft, the height datum is established and misclosure calculated and proportioned along the line. The height of any intermediate point can then be derived. ‑ see Figure 2.
In practice, heights are obtained from profiles flown in a rectilinear pattern over the area to be mapped - see Figure 3. As the levelling control net is marked on the ground only at intervals of some kilometres and is relatively sparse, it is difficult to select points of known elevation at the beginning and end of every line.
However each north‑south or tie line is planned to have a bench mark at the beginning and end, and the east‑west lines intersect the tie lines.
The bench marks then provide the datum for the tie lines and enable heights of the intersection points to be calculated. These intersection points in turn provide the datum for each E‑W line.
From the existing aerial photography of the block, photographs covering the
path of each proposed line are selected and joined together to make a strip
mosaic for each line. Bench marks are plotted and the proposed flight lines
drawn in. These strips of photographs are called 'Navigation Rolls'.
5. WEATHER LIMITATIONS
To obtain optimum profiles, cloud cover and atmospheric thermal turbulence should be minimal. Cloud below the aircraft should be less than 20% on the line, but more importantly, the crossing of one profile with another must be completely clear. Cloud above the aircraft is not a problem unless it is causing turbulence or excessive shadow. When flying over cloud the laser beam is totally absorbed, and consequently there is no return signal and the trace is lost. Furthermore, the cloud obscures detail on the strip film. If cloud is encountered, switching to the coarse ranging phase in short bursts before and after enables the datum to be held. In Australia turbulence can often be avoided by flying about 2000 metres above sea level, but it may be necessary to fly at 3000 metres to keep the aircraft straight and level. Early morning flights are normally best with profiling continuing until the turbulence rises to 3000 metres, which is the limit for the aircraft flying without oxygen. The sun angle is not critical, but long and merging shadows in heavily vegetated areas may make it difficult to see detail on the strip film.
6. PRE‑SURVEY OFFICE PROCEDURES
For planning purposes a scheme diagram at 1:1 million scale is drawn to show all existing differential levelling on the Australian Height Datum. Trigonometrical heights on hill tops are disregarded at this stage as they are generally unsatisfactory for photogrammetric heighting points. Each area where vertical model control is required for photogrammetric compilation is broken down into sub‑groups of 1:250 000 map sheets areas.
The profiling flight lines vary according to the method to be used to intensify the horizontal control. Where the graphical slotted template method is to be employed, the terrain profiles are flown in the side lap of successive east‑west runs of photographs and N‑S tie lines are flown every degree and a half of longitude. Where semi‑analytical methods are to be used with the MODBLOC program, N‑S and E‑W profiles are flown to produce a grid pattern of more widely distributed control points, requiring about 30% less flying.
Each profile line is given a unique registration number to systemise later data collection.
7. PROFILING OPERATIONS
The laser profiler takes twenty minutes to warm up and become operational.
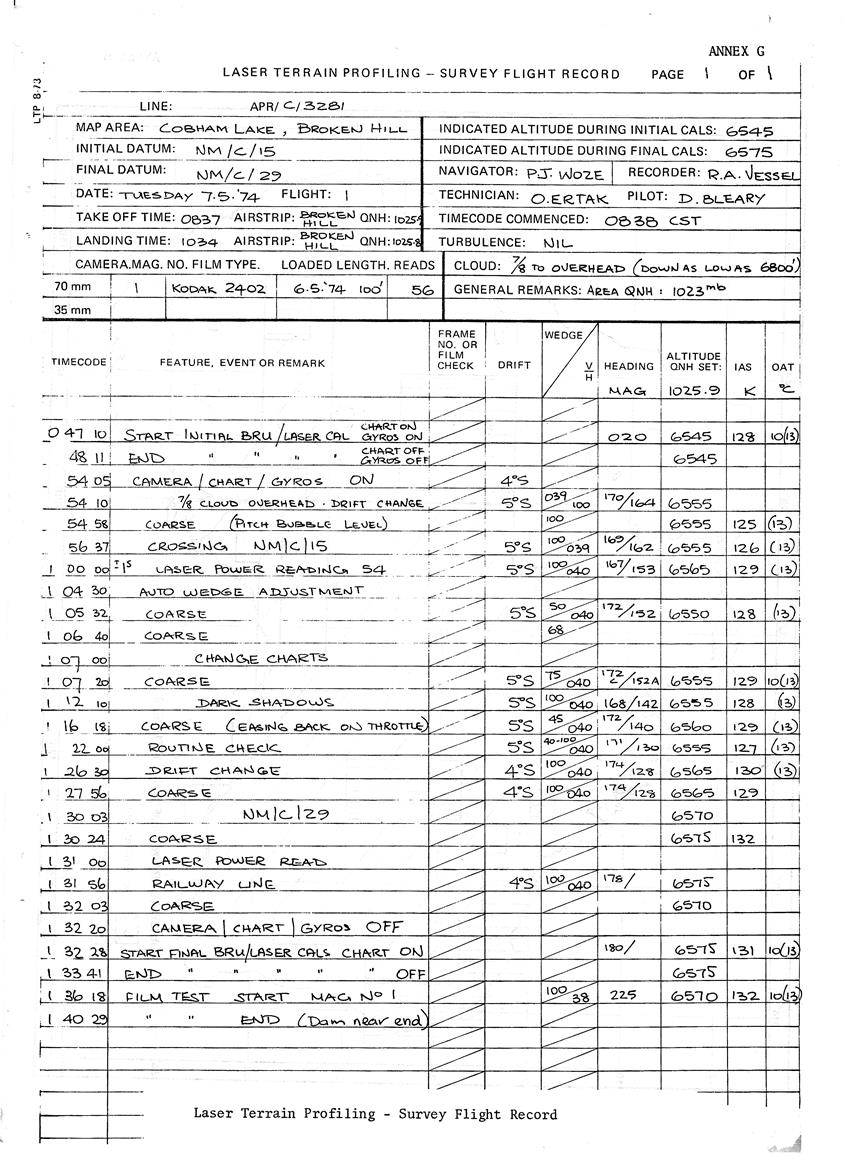
As the aircraft climbs to altitude the navigator prepares his navigation rolls, the booker prepares the flight report ‑ see Annex G, removes the blanking slide, loads a suitable cassette into the camera after scribing the line details on the film and ascertains the correct wedge position for the best exposure. Immediately before starting the line, calibrations are done by the electronics technician.
To obtain the most accurate profile, the fine scale 3 MHz frequency is employed giving a span representing 50 metres across the chart. In order to retain all height information a stepping arrangement steps the profile up or down when it reaches the bottom or top of the chart in exact steps of 50 metres.
Provided the terrain is not too steep these scale shifts can be deciphered, but over rapidly changing steep terrain this is not always possible. To overcome this situation a 500 kHz frequency is employed representing a span of 300 metres. This frequency, although not giving as accurate a profile, is switched in for 1‑2 seconds, especially before and after possible difficult terrain so that scale shifts can be correctly designated.
When all operators are ready, the pilot lines up the aircraft and the navigator establishes precise drift, calling any corrections to the pilot who alters the aircraft's heading accordingly. The booker also notes the drift and adjusts the alignment of the camera.
When recording, heading corrections are kept small to avoid large bank angles and consequential incorrect heighting as the aircraft changes attitude along the line.
Some three minutes prior to crossing the first tie line or ground control point, the chart and camera are switched on in the fine range and shortly afterwards the coarse range is switched in for 1‑2 seconds to establish coarse datum.
Throughout the run the navigator is required to keep the aircraft within 2 km of the planned path using the photographic navigation roll. The timing of the overflight of significant
topographic features is noted by the booker who must also call for changes to coarse range phase if there is danger of losing the fine scale. The booker must be constantly aware of any problems occurring that could cause the line to be aborted.
The electronics technician is responsible for keeping the Laser Profiler running well, switching in the coarse phase, changing charts as required, and periodically noting the condition of the equipment to enable faults to be diagnosed and rectified.
On line, the booker is responsible for monitoring the camera operation, setting the film transport speed and drift, checking exposure and film transportation. Periodically he notes the aircraft's speed, altitude and heading. He is required to note the times of these and other events as indicated by the navigator and the technician to enable selected features to be found quickly during subsequent reductions.
Some 200 kilometres of flight line information is gathered on a single profile chart and, provided that a coarse phase switch is done before and after, chart changes on line are quite acceptable. By mutual agreement, the technician and navigator may change charts so as to avoid running out of chart over important areas. The loss of profile during a chart change averages about five seconds, about 500 m of flight line.
A strip film contains 500 kilometres of profile record, so it is seldom necessary to change cassettes on line.
Three minutes after passing the last tie line crossing or ground reference point, the chart and camera are switched off. The technician records another set of calibrations, and the booker scribes on the film details for the line completed and details for the next line. If time permits another set of calibrations is recorded, but the end set of calibrations for one line are acceptable as start calibrations for the next.
During the return to base the Laser Profiler is shut down, for 10‑15 minutes as the laser unit must cool before being turned off. A test piece of film is exposed by the booker at the camera settings used during the operations. This is developed on landing to check the camera operation. Flight reports are completed and all data is taken to the field office.
8. POST‑SURVEY ‑ IN THE FIELD
The charts need to be edited so that the whole of one line or line segment can be found on a particular chart. Each chart is stamped with the line details at each end and examined for quality.
Exposed film is removed in total darkness and placed in labelled tins. The film test is removed and developed in a small tank to check camera operation and empty cassettes are reloaded with film.
Once the lines have been examined and accepted the line summary is updated.
From the calibration information at the beginning and end of the line the Chart Breakout Sheets are completed and chart scale established. The scale shifts are interpreted and enumerated in increments of fifty metres.
Charts and films, together with their flight reports and breakout sheets, are periodically airfreighted to the office.
9. POST‑SURVEY ‑ IN THE OFFICE
On arrival the 70 mm strip films are sent for processing and a mirror image print obtained. The print is edited and stored with its chart in an individual box. A register cross ‑references the line numbers and box numbers.
10. CONTROLLING THE PROFILES
The ground control already based on the Australian Height Datum (AHD) provides the datum for each tie line.
As the profile rarely passes exactly over the particular ground control, the absolute height of the profile is found by selecting a point on the profile near the ground control and reading the height difference between the two at 1:80 000 photo scale in a photogrammetric plotter. All control points are related to the adjacent profile in this manner. Adopting the elevation of the first point, the elevations of other points are calculated through the profile and compared with the machine values. The difference between the two values is the misclose, which is linearly proportioned along the profile.
Profiles not crossing sufficient ground control points are reduced to the datum using the tie lines. The intersections with the tie lines are determined using the 70 mm film. From the tie line the heights of these intersection points are computed and held fixed. Miscloses of the intersecting lines can be calculated from these values.
11. PHOTOGRAMMETRIC VERTICAL MODEL CONTROL
While each line is being reduced to the AHD, points are selected from the 70 mm strip films to enable each photogrammetric model of the mapping photography to be levelled. Each point is given a number and its position marked on the strip print, paper print and diapositive of the mapping photography. The points are selected for best photogrammetric position, depending on the location, terrain, and profile clarity at that point.
Selected points of detail are aligned with the chart, by the time code along the edges of the film and chart, and their position and number marked. The distance of the laser and BRU trace above their respective chart datums is measured in millimetres and entered on a computation form besides the point number, time code and scale shift.
12. HEIGHT COMPUTATIONS
To convert the chart distances into metres of height, the laser and BRU readings (in millimetres) are multiplied by their respective scale factors calculated from the Chart Breakout Sheet ‑ see Annex E, and then the two values are added together. This sum, plus the scale shift gives the raw chart height. True height is obtained by adding the previously obtained misclose information to the raw chart height.
All heights are calculated to 0.1 m and rounded up to the next metre. Rounding up has been adopted as any undetected aircraft roll will indicate a height that is lower than true on the laser trace.
A programmable hand calculator is used for data reduction.
13. FINAL VALUES
Due to the large amount of computation involved, a sample check of each area is carried out against vertical control not used for controlling the tie lines. Photogrammetric models containing laser heights and existing control are photogrammetrically levelled and residuals read out for the laser height points. Residuals larger than 5 m are investigated and in most cases are resolved.
The final height lists, aerial photographs and diapositives are forwarded for plotting and contouring.
14. ACCURACY
The laser measures the distances to an accuracy of ±0.3 m at all. times; however, cumulative errors due to the dependence on a barometric reference to measure aircraft displacement from an isobaric surface, which is not always stable, and the tilts of the aircraft, can sometimes decrease the accuracy of the system, to ±3 m.
The accuracy figure actually obtained depends on the atmospheric conditions at the time of profiling. In practice, ±2m can be expected. This is about the pointing accuracy of the photogrammetric plotters used on 1:80 000 scale photography, so the two systems are compatible.
This accuracy has been achieved for 1:100 000 mapping of large areas of Australia where no continuous forest cover exists and slopes are gentle. Accuracy deteriorates over timbered mountainous country.
15. RESULTS
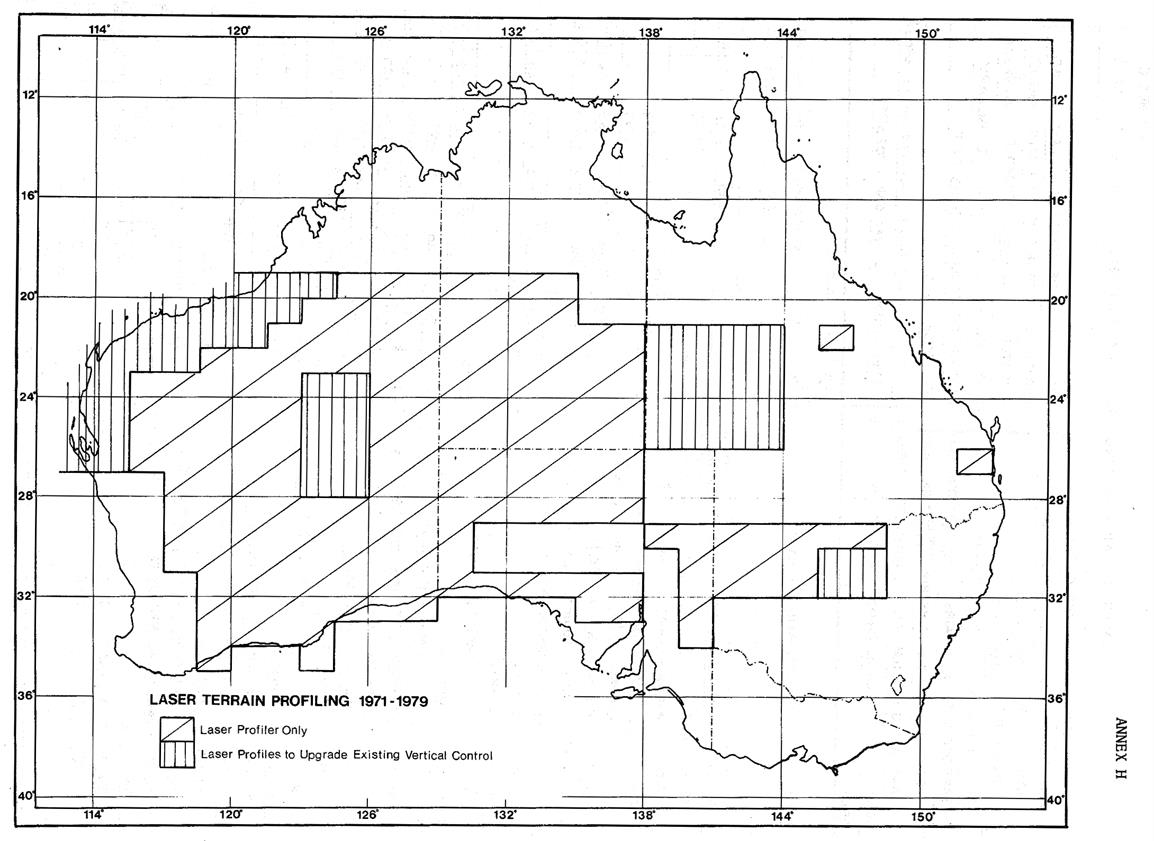
The Laser Terrain Profiler has proved to be of great use for mapping the Australian continent at a scale of 1:100 000 with 20 metre contours ‑ see Annex H. It has been utilised to obtain profiles across published maps as independent map accuracy tests, to measure tree heights, and to provide profile data for microwave link route design. In the last nine years further advances in laser technology has seen a further development of WREMAPS I by W.R.E. to develop and produce a solid state pulsed laser unit, WREMAPS II, for the Royal Australian Survey Corps which has been successfully operated in a Pilatus Porter single engine aircraft. Currently developments are continuing in the application of the Laser Terrain Profiler to bathymetric surveys to provide seabed profiles to a depth of 30 metres.
The field program to provide basic vertical model control is planned for completion by the end of 1979 with consequent office reductions finalised by mid‑1981. Without the Laser Terrain Profiler the provision of model control over the same area would not have been possible in the same time by any other means.
16. ACKNOWLEDGEMENTS
The author acknowledges the assistance and technical expertise of the Laser and Optics Section of the Defence Research Centre (formerly W.R.E.), Salisbury, SA, in maintaining the lasers, and the help of
Messrs R.A. Vassil,
J. Manning
A.G. Turk
R.W. Menzies
and his colleagues in the Division of National Mapping, in editing this report.