SHALLOW WATER MAPPING FROM SATELLITE IMAGERY
by
Paul Wise and John Manning
(Presented at the 3rd South West Pacific Congress, Port Vila, Vanuatu, 6-10 May 1991)
ABSTRACT
The Australian Surveying and Land Information Group (AUSLIG) has the responsibility for the provision of surveying, mapping, geodetic and remote sensing services required for Australian Federal Government programs.
Part of the remote sensing services has been the provision of reconnaissance maps of the shallow water areas of Australia particularly the Great Barrier Reef region. Such mapping has provided a sound basis for an environmental monitoring program to help safeguard and manage shallow water areas, including the establishment of National Marine Parks.
In this paper the production and use of shallow water image maps generated using the BRIAN (Barrier Reef Image ANalysis) methodology using high resolution SPOT multispectral and LANDSAT Thematic Mapper data is described and the Australian experience discussed.
Introduction
Many shallow water areas and offshore reefs within the territorial zones of Pacific Island Nations are known only to the local fishermen and are either inaccurately positioned or not shown at all on any existing mapping. Aside from the fact that inaccurate charting of reefs presents a hazard to navigation, mapping and environmental resource inventory of these reefs could form the basis for the better management of reef resources. This has been Australia's experience with the Great Barrier Reef.
The nature of the waters surrounding island nations is similar to the coastal waters of northern Australia. The reefs in these waters, traditionally dangerous to shipping, defied mapping by traditional means for many years. With the advent of satellite imagery, however, it was found that not only could these areas be accurately mapped but the same digital data could be processed to generate products for monitoring and resource management of remote areas.
The BRIAN (Barrier Reef Image ANalysis) methodology was developed during a collaborative project between the Commonwealth Scientific and Industrial Research Organisation (CSIRO), AUSLIG, James Cook University and the Great Barrier Reef Marine Park Authority (GBRMPA). Its operational use has been reported by Jupp and others (1985).
Since that time AUSLIG has undertaken an extensive program of marine mapping around Australia with the BRIAN methodology mainly using LANDSAT multispectral (MSS) data.
The power of the application of this technology is indicated by the mapping of some 350 000 square kilometres of the Great Barrier Reef using this method at an estimated saving of $A20 million and in considerably less time than that possible utilising traditional surveying and mapping techniques.
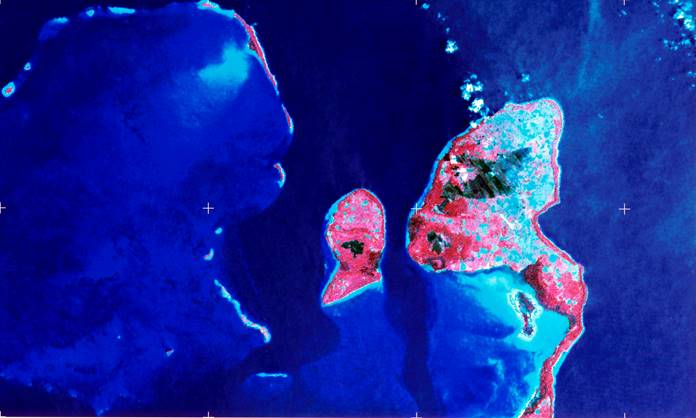
Section of Landsat 2 MSS image, in false colour, of Trobriand islands (North), Papua New Guinea.
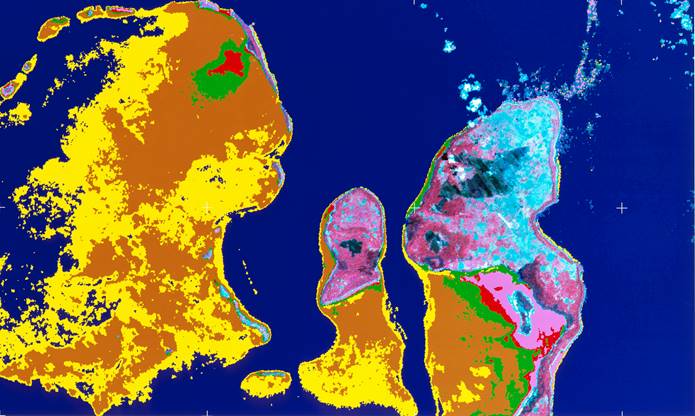
Same region as above after MBRIAN processing to generate a Depth of Penetration image.
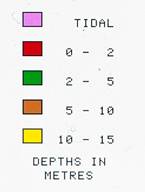
The colour coded depths are listed in the table below.
Shallow Water Mapping with BRIAN
The BRIAN methodology is an approach to digital image interpretation which has been applied as a mini or PC based (microBRIAN) set of interactive programs. The accuracy of this type of mapping is dependent upon the nature of the seabed (topography / cover), water quality (surface conditions, turbidity, suspended sediment) and atmospheric conditions at the time of the satellite overpass.
The standard mapping products from this methodology consist of georeferenced satellite images at nominated map scales. These products highlight different themes such as approximate bathymetry, reef exposure to weather, and reef geomorphology and cover zones. Georeferencing involves the use of points of known horizontal position in the image or a model of the satellite orbit and sensor characteristics to enable the imagery to be remapped to a standard map grid.
The three primary products generated are known as depth of penetration image, reef exposure image, and classified image. In addition, a raw data image can be produced. The raw data image is an enhanced false colour composite of three bands of satellite data and highlights reef shape and position.
Depth of penetration image
The depth of penetration image is an approximate bathymetric map generally delineating five zones of water depth down to a maximum depth of about 15 metres for LANDSAT multispectral (MSS) and SPOT multispectral (XS) data and 25m for LANDSAT Thematic Mapper (TM) data.
The depth to which light penetrates water depends on its wavelength. The exact depth of penetration is affected by many factors, however, in oceanic water the depth of penetration of the LANDSAT multispectral (MSS) and Thematic Mapper (TM) and SPOT multispectral (XS) band wavelengths is given in Table 1.
|
Table 1: Relationship between Wavelength, Sensor Band and Depth of Water Penetration for currently available Satellite Remotely Sensed Data |
||||
|
|
||||
|
Platform/Sensor |
Channels or Bands (µm) |
Pixel Size (metres) |
Swath Width (kilometres) |
Water penetration (metres) |
|
4. 0.50 - 0.60 |
80 |
185 |
15-20 |
|
|
|
5. 0.60 - 0.70 |
80 |
185 |
4-5 |
|
|
6. 0.70 - 0.80 |
80 |
185 |
0.5 |
|
|
7. 0.80 - 1.10 |
80 |
185 |
0 |
|
|
|
|
|
|
|
LANDSAT 5/TM |
1. 0.45 - 0.52 |
30 |
185 |
15-25 |
|
|
2. 0.52 - 0.60 |
30 |
185 |
4-5 |
|
|
3. 0.63 - 0.69 |
30 |
185 |
0.5 |
|
|
5. 1.55 - 1.75 |
30 |
185 |
0 |
|
|
|
|
|
|
|
SPOT 1&2/XS |
1. 0.50 - 0.59 |
20 |
60x2 |
15-20 |
|
|
2. 0.61 - 0.68 |
20 |
60x2 |
4-5 |
|
|
3. 0.79 - 0.89 |
20 |
60x2 |
0.5 |
The depth of penetration for each band (wavelength) in this context is the greatest depth at which the seabed can be seen in the image or, more exactly, where the light reflected from the seabed is detectable against the background. In offshore areas of the Great Barrier Reef the water conditions are such that the quoted penetration depths can be reached easily, although when the water becomes turbid the penetration in each band is reduced.
A number of processing steps are required to generate the depth of penetration image. Land and water features are separated first so that the BRIAN analysis only includes pixels containing water information. From deep water areas in the image the maximum and minimum digital values in each band are established. These values are used to determine the number of pixels in each band that fall into the depth zones of 0-15m, 0-5m and 0-0.5m and deep water. These four zones then comprise a four channel data set from which it is theoretically possible to extract depths at 1cm increments.
Such a close bathymetric interval is impractical to define so the isobathic zoning adopted for Australian Hydrographic Charts is generally used. The depth zones thus produced are 0-1m, 1-2m, 2-5m, 5-10m, 10-15m and deep water.
As the time of satellite overpass is accurately known information on the state of the tide can be used to adjust the final depths. For Australian conditions the tides are adjusted to Indian Spring Low Water. However, because of the large areal coverage of one LANDSAT scene mean sea level may also be adopted. This sometimes causes problems as the actual sea level in an area of the scene may be lower than the mean adopted. In such a case a mean where the sea level is above the adopted mean is selected and then the depth values adjusted to this mean level.
Exposure image
The exposure image is an approximate sea floor elevation model and provides a dramatic enhancement of reef morphology in the same way that relief shading helps in geomorphological mapping on land. This image is generated by the use of a directional filter the direction being that of the prevailing wind and sea conditions.
Classified image
The classified image illustrates a combination of depth and the composition of the reef cover. At the most general level composition may be reduced to cover by coral, coralline algae and sand. Classified images are produced as preliminary products for further detailed study by reef scientists.
Use of the BRIAN Products
All BRIAN products are able to be output on either magnetic or paper media. The paper media currently available are low resolution (100 dots per inch) A4 size ink-jet plots, high resolution (400 dots per inch) A0 size electrostatic plots and colour photographic enlargements (1m x 1m) to scale. For low cost volume printing the digital products may be written to film and printed using a standard lithographic process. This Australian development, SIMAP, ensures that the high quality of the digital product is retained in the printed map.
The BRIAN products are used in a broad range of application areas. The Great Barrier Reef Marine Park Authority applies the product to park planning and management. Similarly, the Australian National Parks and Wildlife Service has derived reef habitat classifications and identified major habitat zones for planning surveys and for the design base for management plans.
A data base has been constructed by AUSLIG for 200 major reefs in the Great Barrier Reef showing the area covered by each depth zone. The area of each depth zone was calculated by converting the number of pixels in a zone, as counted by the computer, by the nominal area of a pixel. With such information marine resources can be estimated from limited onsite field samples gathered for each zone. This information will form a valuable data set for integration into their GIS.
The Royal Australian Navy Hydrographic Service is using the georeferenced imagery in the planning and preparation of new hydrographic charts of Australasian waters while the Bureau of Mineral Resources (BMR) Division of Marine Geosciences and Petroleum Geology has employed enhanced imagery in major research projects over the continental margins of north eastern and western Australia. In particular the imagery assisted the identification of passages in the Great Barrier Reef through which seismic vessels could pass while towing underwater equipment. AUSLIG also uses the imagery for the planning and field execution of bathymetric surveys around the reef areas.
Shallow water mapping has also been produced by AUSLIG in cooperative projects in Papua New Guinea, Djakatra Bay, Indonesia and the Viti Levu reefs off Lautoka, Fiji. The aim of these projects was to demonstrate the applicability of the technique to island nations in the SW Pacific.
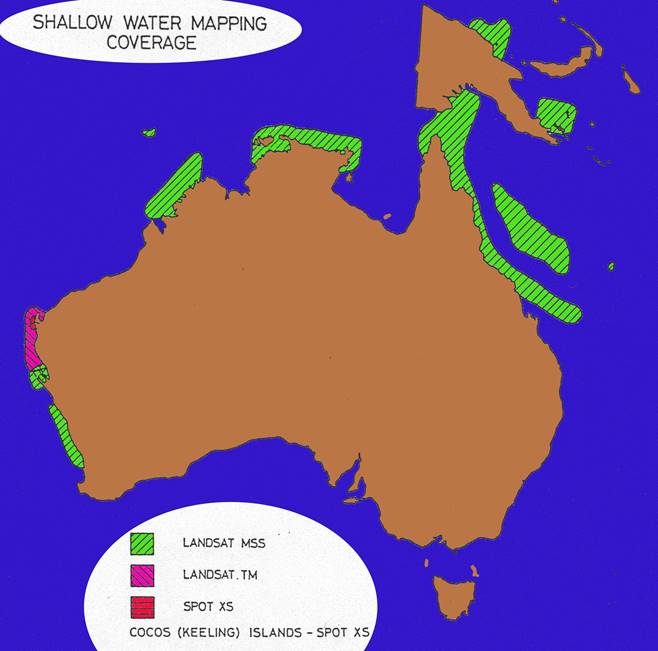
Areas currently mapped using the BRIAN methodology.
Comments on Our Experience
AUSLIG has undertaken shallow water image mapping with both LANDSAT Thematic Mapper (TM) and SPOT multispectral (XS) data. The results indicate that the BRIAN depth of penetration approach to approximate water depth mapping can be successfully applied using either LANDSAT Thematic Mapper (TM) or SPOT multispectral (XS) data.
However, it has been AUSLIG's experience that LANDSAT Thematic Mapper (TM) data is more suited than SPOT multispectral (XS) to the mapping of shallow water as:
- LANDSAT Thematic Mapper (TM) band 1 (blue) allows acceptable mapping to 20 metres depth and was able to detect the seabed between 20 and 25 metres depth. SPOT multispectral (XS) data lacks the blue and mid-infrared band and thus a loss of accuracy results in both shallow and deep water;
- a LANDSAT Thematic Mapper (TM) scene can cover up to 30 000 square kilometres whereas a SPOT scene covers only one tenth of that area. Thus, the cost per square kilometre is reduced and for highly accurate georeferencing fewer ground control points are needed to transform a LANDSAT scene to the local map grid;
- the spatial resolution of LANDSAT Thematic Mapper (TM) data is 30m. SPOT multispectral (XS) data has 20m resolution but the increase in the accuracy of the depth boundaries is marginal. Also, it has been found that wind and wave action affect the processing of the higher resolution SPOT data;
The depth of penetration maps are labelled not for navigation - reconnaissance purposes only, however, the depths shown will always tend towards being shallower than may actually exist thus careful use should not compromise safety.
The current LANDSAT satellites 4 and 5 do not have an onboard tape recording ability. Data acquired outside the region of direct reception of a ground station must be relayed back to the USA via the Tracking and Data Relay Satellite (TDRS). LANDSAT 6 is due for launch early in 1992 and in addition to having essentially the same complement of sensors acquiring the same coverage as LANDSAT 5, LANDSAT 6 will have onboard recording capability and thus this constraint will be overcome.
Our assessment of all these factors indicate that LANDSAT Thematic Mapper (TM) is the most cost-effective data for this particular application.
Summary
A single LANDSAT Thematic Mapper (TM) scene covers an area in excess of 30 000 square kilometres. The processing of such an area to produce reconnaissance bathymetric maps and the other BRIAN enhanced images takes a few days. The result is a vast area of ocean rapidly and safely mapped in a relatively short time.
It is not an understatement to say that a program to use the BRIAN methodology to map an area of some 250 000 square kilometres (500km x 500km) would cost around $A0.5 million including the purchase of the technology and the data. The contribution to any nation's economic development and to the preservation of selected offshore environments would soon exceed this initial investment and provide the basis for ongoing monitoring and management of a major resource.
Acknowledgements
The authors acknowledge the contribution made to this paper by the staff of ACRES Applications Section at AUSLIG who operationally use the BRIAN methodology.
REFERENCES
Gray, D., Holland, P. and Manning, J. 1988. The Marine Remote Sensing Experience of the Australian Surveying and Land Information Group. Proceedings of the Symposium on Remote Sensing of the Coastal Zone, IV.1.1 - IV.1.16.
Jupp, D., Heggen, S., Mayo, K., Kendall, S., Bolton, J. and Harrison, B. 1985. The BRIAN Handbook - An Introduction to LANDSAT and the BRIAN (Barrier Reef Image ANalysis) System for Users. Natural Resources Series No.3, Division of Water Resources, CSIRO.