A History of Satellite-based Remote Sensing in Australia:
1970-1989
Humanity must rise above the Earth, to the top of the atmosphere and beyond, for only then will we fully understand the world in which we live.
-- Socrates, 500 B.C.
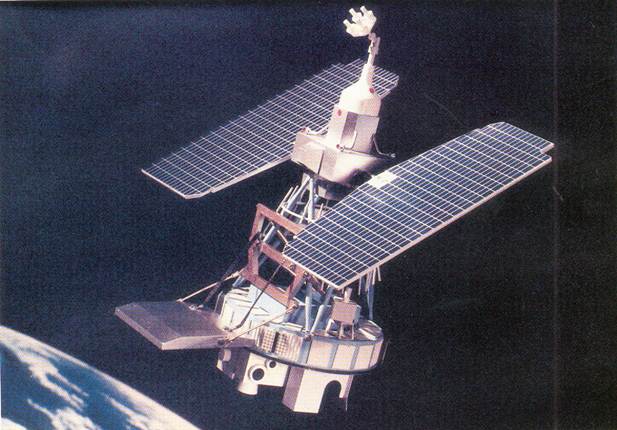
Figure 1: Landsat Satellite
(Satellite Images of Australia)
Introduction
Australia is a vast country, with an area of a little over 7.6 million square kilometres. Its population is concentrated into a small fraction of this, with 83% living within 50 km of the coast. Most of these people are clustered on the eastern seaboard, with a small crescent in the south-west. In addition, Australia is a highly urbanised country with almost 88% of its population living in towns or cities with more than 25 000 people. This leaves huge areas, far bigger than many entire countries, with very sparse population and, at least until very recently, communications and transport infrastructure was confined to a few well-defined routes. Finding out what is happening, or even what exists out there, can be very difficult, expensive and extremely time-consuming. For many thousands of years, every time we wanted to know something about the interior of our country the only thing to do was for somebody to go and look, either with their eyes or some form of data recorder.
This difficulty in obtaining information did not stop people from wanting it, or from going to the, often considerable, effort to capture and pass on information about every part of Australia. Stretching back thousands of years, to the creation of Aboriginal paintings and engravings showing the location of game and water, the mapping and description of the landscape and its resources has been a major preoccupation of the people who live here. The arrival of European settlers led to an upsurge in map-making and formal exploration and description of the landscape and its resources.
Images of the earth from early earth-orbiting and lunar spacecraft had a powerful effect on how we saw the world. Pictures from the Gemini and Apollo missions showed us the world as a single entity, on a scale never before seen. They gave the first inkling of how much could be seen if you went up far enough. In the words of space shuttle pilot Donald Williams:
For those who have seen the Earth from space, and for the hundreds, perhaps thousands more who will, the experience most certainly changes your perspective.
The images from these space missions were, on the whole, incidental to the mission purpose.
With the launch of the first of the TIROS series of meteorological satellites in 1960, another source of images from space became available. As with the images from space missions, their main purpose was not to show images of the Earth’s surface. Despite this, pictures from both sources excited interest in using satellites for observing the earth. Eventually this interest resulted in NASA initiating the Earth Resources Survey Program in 1965 to develop methods for remote sensing of the earth from space.
The launch by NASA (the National Aeronautical and Space Administration of the United States of America) of the American Earth Resources Technology Satellite, ERTS-1 (later renamed to Landsat-1) on 23 July 1972 opened up a new world of data about the surface of the Earth. For Australia, with its huge distances and localised population, the opportunity was too good to miss. For the first time, areas of the Australian landscape could be viewed, mapped and analysed without anyone needing to walk, ride, drive or fly over them.
Every 18 days the satellite recorded the data and transmitted it to earth. Only one satellite was required for the whole planet and, under the terms of the NASA survey program, all countries were to have access to the data.
Starting from a position of considerable expertise in the use of aircraft-mounted remote sensing equipment, Australia quickly developed into a sophisticated user of images, and later digital data, from satellite systems. The uniquely varied nature of our terrain and vegetation, ranging from tropical rainforest to arid semi-desert, led to a series of innovations in processing and interpretive techniques that were taken up all over the world. In the words of Jon Huntington, now a Chief Research Scientist in the CSIRO Division of Exploration and Mining: “If it works in Australia, it will work anywhere”.
The history of satellite-based remote sensing in Australia is full of people: space scientists, geologists, ecologists, spectroscopists, chemists, technicians, and engineers. Particularly in the early years they came from an enormous variety of backgrounds, each contributing their own particular set of skills to the development of the field of remote sensing. Some were interested in remote sensing for its own sake, looking for new and interesting applications of the techniques they developed. Others saw it as an important tool for furthering their research within a particular discipline. Some people worked in the field for only a short time, trying out the techniques and then moving on. Those who stayed working in remote sensing were often enthusiasts who constantly sought new and better uses for remotely sensed data, infecting and inspiring others along the way. The core group of people from the early years is quite small, but their enthusiasm is enough for a crowd of hundreds.
Within a few years of joining the world of satellite-based remote sensing, Australia was a major user of satellite data and a leading innovator in the application of remote sensing to a wide range of resource management, exploration, and planning applications. Many of the processing and interpretation techniques developed here were eventually exported all over the world.
The Beginnings of Remote Sensing in Australia
The idea of using remote sensing as a tool for a range of applications was well established in Australia by the late 1960s. Several different types of aircraft-mounted sensors: multi-band photographic, thermal, colour infrared photographic and Side Looking Airborne Radar were all in use, particularly for mineral exploration and geological mapping. Aerial photographs were also being used for more general mapping and surveying. In addition there was some work being done on determining the ecological characteristics of large areas using aerial photographs taken from either balloons or small aircraft.
As far back as the late 1920s geologists and geophysicists had begun using black and white aerial photographs for geological mapping. By the mid-1960s the field of photogeology, as it came to be known, was well established and continuing to evolve rapidly. Using a combination of aerial photographs and ground traverses, the Bureau of Mineral Resources, Geology and Geophysics (BMR) was mapping and analysing the Kimberley region of Western Australia. In 1966 they began experimenting near Brisbane with black and white infrared aerial photography.
By the late 1960s BMR even had some experience with images from space. In 1965 astronauts on NASA’s Gemini V manned mission took some hand-held photographs of central Australia during one of its earth orbits. Some of these were used to evaluate the Amadeus Basin and one, of the country to the west of Alice Springs, showed the circular Gosse Bluff. Analysis of this image gave rise to the theory that it was an impact crater from either of meteor or a comet. Detailed ground-based investigation by the BMR and the US Geological Survey (USGS) investigation, showed it to be formed by a comet impact.
In the late 1960s the CSIRO Division of Land Use Research was starting to test and use a system developed in-house that used colour aerial photographs for land use capability mapping. Unlike the geologists, the land use researchers needed colour images, making this system costly and time-consuming.
This breadth and depth of expertise and experience set the stage for Australia to take full advantage of data from satellite-based systems.
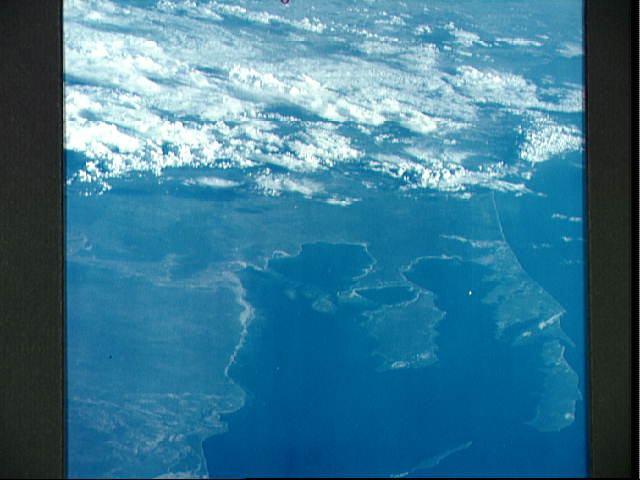
Figure 2: Shark Bay, Western Australia as seen from
Gemini 6.
(NASA website)
Images from Satellites
Australia’s involvement in satellite-based remote sensing really began in the early 1970s when the National Aeronautics and Space Administration Agency of the United States of America (NASA) issued a worldwide Statement of Opportunity to potential experimenters and users of data from two planned earth-observing satellites: ERTS-1 and 2. These satellites marked the beginning of non-meteorological, high resolution observations of the earth’s surface, with particular emphasis on the mapping of natural resources, terrain and environmental assessment. The satellite family was originally named to reflect its purpose: Earth Resources Technology Satellite. These satellites were renamed “Landsat” in 1975, a name that continues until the present day. To save confusion, the family will be referred to as “Landsat” in this history. NASA was looking for principal investigators from around the world who would be provided with free imagery in return for reports of their significant results.
Very few people in Australia at that time had any direct experiences with satellites or satellite data. One who did was Ken McCracken, chief of the newly-formed CSIRO Division of Mineral Physics, who had worked in the United States at the Massachusetts Institute of Technology with Bruno Rossi designing instruments for spacecraft. From January to September 1970 he convened an interdepartmental committee to co-ordinate Australia’s response to the Statement of Opportunity. The committee included representatives from CSIRO, BMR, the Division of National Mapping, forestry and astronomy.
There were some people, particularly those using sophisticated aircraft-based remote sensing techniques, who had serious doubts about the potential value of the satellite images. Some went so far as to use the phrase “remote non-sensing”. The main perceived drawback was the huge difference in resolution: the aerial photographs being used were usually stereo pairs with a resolution of one metre; in contrast, the satellite images were monoscopic and had a resolution of 80m. In the end there were enough people who could see potential in the new technology to come up with a total of 53 research proposals relating to the use of Landsat images. These were then forwarded to NASA with Norm Fisher, Director of the BMR, as principal investigator.
Initially Australia was cautious about accepting some of NASA’s conditions for the supply of satellite images. The Department of Supply in particular was very concerned about security. The American “open access” policy made it possible for the images to be widely distributed around the world. Eventually the conflict was resolved and in mid-1972 the Australian Committee for (the) Earth Resources Technology Satellite or ACERTS was set up as the umbrella group for the Australian principal investigator and co-investigators. Its membership was essentially the same as that of the original interdepartmental committee and it was chaired by Norm Fisher from the BMR.
Interest in the satellite data was continually growing and in late 1971 the CSIRO Division of Mineral Physics established a remote sensing group as one of its five programs. The division was still very new, having only been set up in the middle of 1970. Ken McCracken’s background in space physics and satellite instrumentation helped the division to become one of the earliest organisations in Australia to become involved in remote sensing.
At around the same time a small company, Technical and Field Surveys Pty Ltd, began positioning themselves to take advantage of the satellite data. The company had been incorporated as a spatial information and remote sensing company by Mike Aubrey in 1970. So far it had specialised in the integration of rock classification and geological mapping for the whole of Australia. As with many organisations in this field, using satellite data was seen as a natural and powerful extension of what they were already doing. An ex-NASA astrophysicist who was then working at the University of Newcastle, Gail Moreton, was recruited in early 1972 to help develop this capability. Later that year Technical and Field Surveys became an observing member of ACERTS.
After years of planning and waiting, Landsat-1 was launched on 23 July 1972. The launch went smoothly and data transmission started soon afterwards. The satellite carried two main instruments: a trio of Return Beam Vidicons (RBV) and a Multispectral Scanner (MSS). The former were basically television cameras that took a series of snapshots of the ground along the path of the satellite. Each of the three cameras had a different filter on it that allowed a different spectral band (essentially ‘colour’) to be recorded. The resulting images each covered an area 185km x 185km. This means that the whole of Australia could be covered by just 500 Landsat images. The MSS was a mechanical scanner that detected reflected sunlight in several different spectral bands. It detected red, green and two different near-infrared wavelengths. Again the image size was 185km x 185km. The effective ground resolution of both instruments was about 80m x 80m. The satellite had a pattern of 14 orbits per day, giving complete coverage of the earth’s surface every 18 days.
Data from the instruments for North America was transmitted directly to one of the three ground stations in the United States: Fairbanks, Alaska; Goldstone, California; or Greenbelt, Maryland. Data for most of the rest of the world was recorded on one of two tape recorders and transmitted to one of the ground stations when the satellite was within range. The exceptions were countries such as Canada, Brazil and Italy which had built their own ground stations and paid NASA for their data supply.
A measure of the importance of Australia’s involvement in remote sensing was a briefing given to the US Senate in early 1972 by the director of the BMR, Norm Fisher, which emphasised the importance of the Landsat program to mineral exploration.
In July of 1972, just at the time Landsat-1 was being launched, CSIRO Mineral Physics held a briefing on satellite-based remote sensing. This was well-attended with representatives from a wide variety of resource management and land use applications. One of the delegates was a recent PhD graduate working in the CSIRO Rangelands Research Unit, Dean Graetz. Like many others, he had been sent along by his work area to see if this new data source would be interesting or useful. While there was no real data at this stage, some mock-ups based on multi-spectral photography from NASA and CSIRO had been produced to give an idea of what the new images might look like. To quote Dean Graetz: “a summary of our collective reaction was ‘Wow!’” [Graetz, D. (Unknown) MSS: A great beginning with no end in sight]
Ken McCracken remembers:
CSIRO had funded Remote Sensing in my Division by a $5,000 levy on other divisions. Dean started his talk:”Other people have come to see what remote sensing is all about. I’ve come to see what you’ve done with our money!”
Images from Landsat-1
The first real images began arriving in Australia later in 1972. Among others, the photogeology group at the BMR was asked to assess the new technology for usefulness. Colin Simpson was one of those tasked with this:
For the Australian analysts, it was an easy step from aerial photos to the large Landsat images. Because Australians had such as history of using aerial photography, the information about surface geology and vegetation was not of huge interest. In fact it was of far lower resolution than the photographs we were already using. What got the Australians excited was the scale, how much you could see in each image. This allowed for the mapping of major geological structural features such as lineaments, fault lines and tectonic boundaries which allowed increased understanding of subsurface structures [Interview, 11 October 2001.[1]].
For some researchers, their first experience with satellite images has remained impressed on their memory for almost 30 years. In February 1973 Dean Graetz was based in the small NSW town of Deniliquin, working on rangeland management issues in the Broken Hill area:
But it was on that February morning and I was doing research on the diets of sheep and cattle and a letter, a large photographic paper box appeared in my pigeon-hole at work and I opened it up, it was after morning tea, I remember it very well. I walked down into the sun and it was a whole bunch of 9-inch by 9-inch positive film and one of them was the Broken Hill scene. I held it up to the light and I was just, actually overwhelmed. Just the incredible amount of information that I could interpret out of that single-band image. And when I saw the false-colour version I was truly absolutely entranced. I could see a great deal that I could interpret about the nature of the landscape and the effect of land use on it [Interview, 1 November 2001].
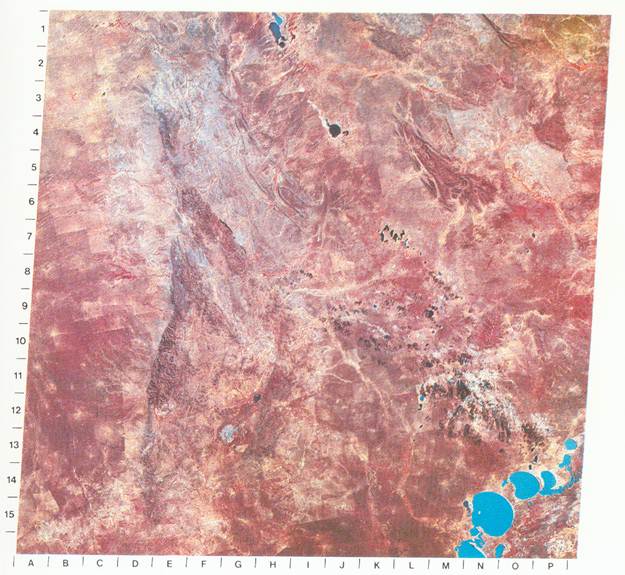
Figure 3: Rangelands Around Broken Hill, NSW
(Satellite Images of Australia)
Government organisations were not the only ones to use the new data. Technical and Field Surveys managed to be receiving and interpreting Landsat images within six weeks of the satellite’s launch. The company also negotiated a data supply agreement with the USGS Earth Resources Observation Systems (EROS) data centre that had them selling images within Australia and even back to America.
Characteristics of the Images
The data recorded on the satellite and transmitted to the ground stations was digital and at first the data processing for countries without a ground station was done at the NASA Data Processing Facility of the Goddard Space Flight Centre in the USA. Photographic images were then distributed to the principal investigators. Initially all images for Australia were sent as 70mm photographic negatives to the Division of National Mapping for reproduction and distribution. This led to problems with image quality.
The EROS Data Centre in Sioux Falls, South Dakota was also processing Landsat data and creating photographic images and in 1973 images for Australia began to be sourced from there rather than NASA. These were available as 23cm x 23 cm (9” x 9”) film positives or negatives. At this size, the image scale is 1:1 000 000, in other words 1cm on the image corresponds to 10km on the ground. While the effective resolution on the ground is 80m x 80m, linear features as narrow as 10m can sometimes be seen if they are in sharp contrast to their surroundings.
The images were distributed as black and white photographs for each of the four spectral bands and a false-colour composite based on the standard already in use for infrared aerial photography. For this type of false colour image, colours are assigned to three of the four MSS bands:
· Data recorded as green is displayed as blue;
· Data recorded as red is displayed as green; and
· Data recorded as near infrared is displayed as red
In these standard images, growing vegetation, because it is highly reflective in the near infrared, appears in shades of red; rocks and soils are shades of blue through to yellows and browns; and water will usually range from blue to black depending upon how deep and how clear it is. Man-made structures such as buildings and roads show up in shades of blue and black with characteristic regular patterns. These colours are only a rough guide and can be influenced by many factors such as the angle of the sun, which varies with the season, atmospheric conditions and seasonal changes in vegetation. The main advantages of using a standard mapping of colours to the MSS bands were that it is easy to become familiar with the meanings of the different colours, leading to fast, high-level analysis of the images just by looking at them; and it made full use of the existing interpretive skills developed for aerial photography.
Initially the main users of the false-colour images were those interested in vegetation. The mining and minerals people tended to use black and white images. Only 7% of the images supplied in the early months were false-colour, giving an idea of the dominance of remote sensing by geological applications at that time.
Backgrounds of Early Australian Participants
As satellite images became available, people started working with them for many different reasons and, because there was not yet any formal training in remote sensing available in Australia, they came from a wide range of backgrounds. Some, like Ken McCracken came from a space science background, others like John Perry and Colin Simpson from geology, with others, such as Dean Graetz, coming from ecology, oceanography, mining and rangeland management.
A common pathway into remote sensing in these early months seems to have been for a new member of a work group, often a recent PhD graduate, to be sent to “find out about this remote sensing stuff”. The philosophy was that it was better for someone new and junior to spend time seeing if it was going to be useful rather than wasting the time of someone who was already doing important work.
Two people from the same background who both did receive formal training in remote sensing were Andy Green and Frank Honey. They were both chemists specialising in spectroscopy during their PhDs at the University of Western Australia. In successive years they had CSIRO post-doctoral fellowships at Stanford with Ron Lyon, also an Australian, specialising in remote sensing. When they returned to Australia, Andy Green went to work with Ken McCracken in Mineral Physics at North Ryde in Sydney while Frank Honey started a remote sensing group in the CSIRO Division of Land Resources Management at Floreat Park in Perth.
Early Education and Training in Australia
Some of the first training courses in remote sensing techniques held in Australia were given by the BMR through the Australian Mineral Foundation (AMF) in 1972 and 1973. The AMF was formed by a collection of companies in the early 1970s as a vehicle to promote and foster applied training, information services and an industry bookshop for the minerals and petroleum industries. The courses took the form of industry-focussed short courses and were well attended. On one of the first courses were several people from the mining industry who were to go on to become major players in remote sensing. Among them were Kerry O’Sullivan of CRA and Mike Hussey of De Beers Australia. These short courses continued for the next ten years.
Status of the Landsat Program
When the Earth Resources Survey program was initiated by NASA in 1965, it was essentially an experimental program. Landsat-1 was designed as a research and development tool to demonstrate the feasibility of systematic remote sensing from Earth orbit for resource and environmental monitoring. During 1973 and 1974, with use of both images and digital data from the satellite increasing, there was debate in the US government about the administration of the program. The main question was whether it was still an experimental program or whether it should be reclassified as operational. The result was that the program continued as experimental until 1979 with NASA and the US Department of the Interior required to ensure continuity of data.
In 1975 NASA changed the name of the satellite program from ERTS to Landsat. The second satellite in the family, Landsat-2 was launched on 22 January that year.
First Principal Investigators’ Symposium in Australia
In 1973 the first ERTS symposium was held in Australia. This brought together all the members of ACERTS to report on the research they had been doing based on the satellite data. After less than a year of receiving data the range of applications was already very broad. The presentations covered topics such as rangeland management, assessment of flooding and salt damage, geological mapping, mineral exploration, agricultural yield assessment and management, environmental surveying, forestry and mapping (both topographic and bathymetric).
Different applications found different advantages to using the satellite data. For rangeland management, one of the key advantages was the relative cheapness of the data. Typically Australia’s rangelands are of low productivity and hence low commercial value. This does not reduce the need for them to be carefully managed to prevent their degradation from over-grazing. With pictures needed on a regular basis, the cost of aerial photography was too high for it to be perceived as a sensible tool for managing rangeland.
As explained earlier, for geological mapping and mineral exploration, the advantage of the satellite images lay in their scale. With aerial photography it was very difficult to make a seamless mosaic of a large area. Slight differences in exposure and camera angle meant that there had to be careful manipulation to create a mosaic of a large area. Not only did the Landsat images cover comparatively huge areas, they were far more uniform in angle and coverage, making it easier to combine them into mosaics that could cover entire continents.
As far as using satellite images for topographic mapping went, again the advantage lay in the scale and uniformity of the images. The distortions were small enough for the images to be used as the basis for maps at a scale of 1:250 000. Although most of Australia had been mapped at this scale, the satellite images provided valuable cross-checking and validation of work done from aerial photographs.
Limitations of Images
As Australian use of the images became more sophisticated, dissatisfaction with the image quality grew. One of the major problems arose from the unique characteristics of the Australian landscape. In the available image set, Australia was always very bright, much brighter than most other countries. This meant that many surface details were effectively lost in the glare. The problem with the images arose because the data for outside the USA was all processed in the same way before transferring to film, regardless of the underlying characteristics of the landscape. This meant that it was effectively optimised for areas of average brightness.
In addition, the only images supplied by NASA were black and white negatives for each spectral band and a standard false colour composite for each scene. Which spectral bands, or combination of spectral bands would be most useful to a researcher depended greatly on what features of the landscape were being studied. Changing the combination, intensities and colours assigned to the different bands could greatly enhance different features of the scene. While this was possible using the black and white negatives of each band, this was time consuming and often tedious.
The obvious next step for Australian researchers was to go back to the source data and see if the processing could be optimised for our landscape and vegetation.
The final issue was that the usefulness of the images depended very much on the cloud cover when they were recorded. Up to 20% was often considered reasonable. This was not usually a problem, unless of course the cloud covered the part of the scene of most interest to the person who had ordered it. The NASA cataloguing system gave no information about cloud cover, and so with no Australian-based image processing, it could take a frustratingly long time to select and order a scene only to find that the most important area was hidden by clouds.
All these limitations led to the push for magnetic tapes of the digital data to be sent to Australia for processing.
Digital Satellite Data
One of the first people to start looking seriously at the digital Landsat data was Andy Green in CSIRO Mineral Physics. In 1974 he and some colleagues began experimenting with digital Landsat data and found that by reprocessing it he could uncover much of the detail that had been hidden in the previous very bright images. For an example of this, compare Figure 4 with Figure 5. Both were produced from the same digital source data, obtained on 18 December 1972. As there were no desktop computers or high-quality displays at this time, the team from Mineral Physics had to spend time building image processing and display equipment as well as developing algorithms to process the data. The electronics engineer in this team, Guy Roberts, built the first three image processing systems “from the chip up” [Jon Huntington interview, 12 April 2002].
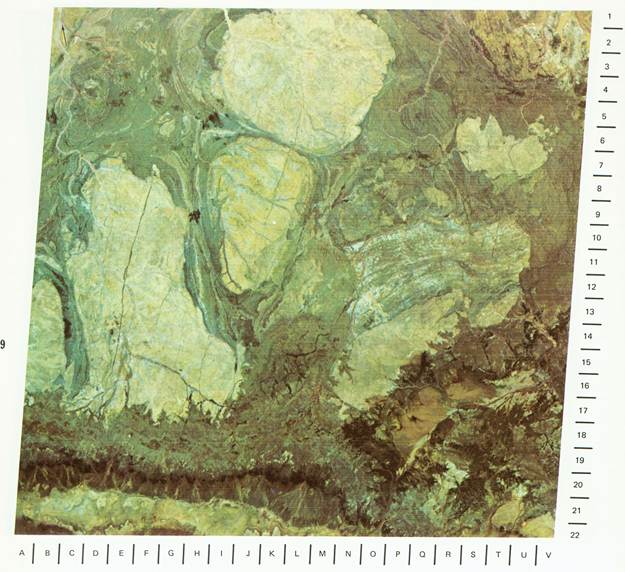
Figure 4: The area around Marble Bar, as processed by
NASA
(Mission to Earth Landsat Views the World)
Andy Green’s work became part of a CSIRO Division of Mineral Physics project, investigating the use of digital data for mineral exploration and the mining industry started to take a major interest in the results. An image that captured their imagination and interest was a scene showing an area of the Pilbara around Marble Bar in Western Australia (see Figure 4). As a region rich in iron ore deposits, the mining company people knew this area well: they had driven over it, flown over it, prospected and mapped in the area. The geology was very familiar to them. In this image, they could simply see the geology and, from their existing knowledge, tell that they were seeing it with remarkable accuracy. Kerry O’Sullivan from CRA was one of the first in the mining industry to see the usefulness of remote sensing as a tool for mineral exploration.
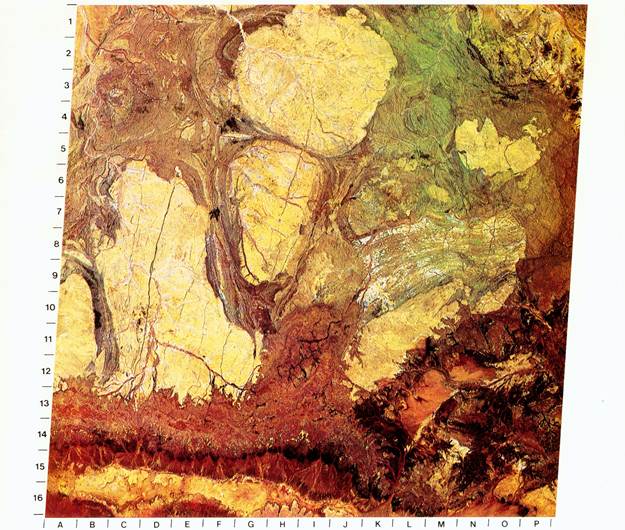
Figure 5: The area around Marble Bar, as processed by CSIRO Mineral Physics
(Satellite Images of Australia)
Another key person, Jon Huntington, joined CSIRO Mineral Physics in April 1974, just in time to become involved in the interpretation of the newly-processed data. He and Andy Green began a partnership that was to last for many years, with Andy focussing on the technical and data-processing aspects of various problems while Jon concentrated more on the interpretive and geological dimensions. Initially Jon joined the division on a one-year contract, which became two years and then four… in the late 1970s he finally became a permanent member of CSIRO staff.
Expanding Use of Satellite Data
In 1973 CRA was responsible for a joint venture which discovered diamonds in the remote Kimberley region of Western Australia. Prospecting in this region was extremely expensive and satellite images seemed to have great potential for narrowing the search for more diamonds. Armed with the knowledge of what the area where CRA had already found diamonds looked like, Kerry O’Sullivan was then able to look for similar areas on the satellite images, narrowing the search considerably. For the initial work CRA used tapes and analysis equipment at CSIRO Mineral Physics. As the work progressed, the staff from CRA became more and more concerned about maintaining commercial confidentiality and limiting the number of people who knew what they were doing. The crunch came one day when Ken McCracken, looking for Andy Green, walked in on a private viewing of the results of some data analysis. Ken recalls:
And for a long time the only equipment in Australia that would allow you to produce pictures on screen or nice photographs from tape was in an old army hut up at North Ryde. I went over to see Andy about something, I’m not sure what, and he was in the dark room and there was a number of people in there and they were as embarrassed as hell that I was there.
…And they didn’t want anyone to know, not even the Chief of the Division
… Anyway my point is that CRA immediately decided “we need some equipment like this so that people like McCracken don’t keep walking in on us” [McCracken Interview 3 October 2001].
Within a few years of digital data becoming available there were several organisations capable of processing it. The two main barriers were the requirement for about $250 000 worth of computer equipment, an enormous sum in 1975, and sufficient expertise to use it. The main organisations involved in image processing were CSIRO, BMR, BHP, the Division of National Mapping and two mining companies, CRA and Western Mining.
As mining companies began using satellite data more and more they became increasingly concerned about security. They often asked for far more scenes than just the one they were interested in with the hope of hiding where and what exactly they were looking at. This need for confidentiality also led to the development of image processing facilities at another six mining companies in addition to CRA. As the main source of computer tapes at the time was CSIRO Mineral Physics, much of the division’s work was funded by the fees the mining companies paid for the data.
With tapes of digital data arriving at Mineral Physics on a regular basis, the division soon built up a considerable archive of Landsat data. By 1975 they were the principal repository for these computer tapes in Australia.
Alongside all this activity in the mining sector, there was increasing activity, although on a much smaller scale, in the environmental sector. The timing of the launch of the first Landsat had been lucky for the land use researchers as it occurred just before the strong El Niño event of 1972-3. This meant not only that there was a major drought, but that large areas of Australia were almost cloud-free for long periods. In contrast, 1974-5 was one of the wettest periods on record. Having these two events so close together, and having satellite images showing vegetation changes and floodwater coverage was of immense value. These images are still used, nearly 30 years later, as a basis for comparing more recent data.
Landsat was not the only satellite providing data for earth resource uses. In Western Australia, Frank Honey was using data from an old National Oceanic and Atmospheric Administration (NOAA) satellite for some oceanographic work. As it happened, Frank had written a program to process this data for a fellow student during his time in the United States. At that time it could take up to 12 weeks to get data from NOAA in the United States, if indeed the required time and place was available. Eventually this became deeply frustrating and so Frank looked into building a simple receiver to pick up the satellite data directly.
In the early 1980s, he liaised with Bill Carroll at Curtin University (then the Western Australian Institute of Technology) about building a receiving station for the NOAA data. Within six months of coming up with the specifications for a receiver they had built one and installed it on the roof of a building in Perth. The main limitation of the equipment was that the satellite had to be tracked by hand using an oscilloscope to track the signal strength, automatic tracking being an expensive luxury for this essentially home-grown equipment. The engineering students at Curtin University became very involved in the design and building of the receiver, showing great enthusiasm for the project. When they called for student volunteers to help with the hand-tracking they had so many that they had to draw up a roster, even for the 3am shift. Using this equipment, they got some lovely pictures of volcanic ash clouds from the eruption of the Galunggung volcano in the west of the Indonesian island of Java that caught the public interest at the time.
The Push for Australian Data Reception
As the worldwide use of images from Landsat-1 and 2 increased at a great pace, demand on the American image processing and data distribution facilities also increased. As Australia was only one of the many countries wanting to use Landsat images and data, this led to frustrating delays in the supply of computer tapes and images covering Australia.
Another problem was that between 1972 and 1974 there were intermittent problems with the data recording equipment on the satellite. With limited storage capacity on the tape, delays in transmission could mean that scenes were overwritten before they could be downloaded. This could result in gaps of many weeks rather than 18 days between successive images of the same scene, which was a particular problem for the environmental scientists wanting to look at changes in the landscape.
In addition to these immediate issues, NASA was starting to plan future satellites which would not carry on-board data recorders. Data from them would only be available through direct transmission.
In the last months of the Whitlam government, the Minister for Science, Clyde Cameron, asked the Australian Science, Technology and Engineering Council (ASTEC) to consider a conceptual proposal to establish Landsat reception facilities in Australia. There was resistance from a significant number of ASTEC members to making such a large investment in what was perceived to be primarily outmoded American military technology. ASTEC recommended against the proposal.
In 1976 CSIRO Mineral Physics proposed a remote sensing research program to Australian mining companies through the Australian Mining Industry Research Association (AMIRA). The program ended up attracting ten companies as sponsors, which, considering the size of the industry, was a very high level of support. Over the next ten years this support from the mining community via AMIRA was vital for the developments in the application of remote sensing to mineral exploration and more generally in the acquisition and processing of satellite data. The AMIRA project has been repeatedly funded up to the present, underlining the relevance of the research group and the continuing interest of the industry in pioneering remote sensing research and applications.
By the mid-1970s state governments were becoming increasingly involved with the use of satellite data. Not surprisingly Western Australia quickly became one of the major players. The state, with its vast distances and intensely localised population, was in some ways an extreme illustration of the advantages of remote sensing for Australia. South Australia, another state with large remote areas, also became very involved.
In 1977 ASTEC were again asked to consider a proposal for establishing Landsat reception facilities in Australia. This time the proposal was vigorously supported by the mining industry, which guaranteed to buy enough data to make the project work financially, and the committee was far more sympathetic to this type of technology. The proposal was accepted and a recommendation forwarded to Cabinet that the Australian Landsat Station (ALS) be built. A key figure in this was the chair of the ASTEC subcommittee, Professor Lou Davies, an electrical engineer and scientist of high repute. In the words of Ken McCracken, “he was a technologist with far-sighted vision”.
Someone who had been interested in the Landsat program from the outset was Don Gray, Director of Honeysuckle Creek Tracking Station. His interest and enthusiasm, as well as his background dealing with space technology had led him to give some lectures about the Landsat program to organisations like the Institution of Engineers and the Institution of Radio and Electronics Engineers. He had to strike the difficult balance between arousing interest with his enthusiasm and making a common mistake of the space industry by overselling the project as a panacea for all the world’s ills.
In 1977 Don was heading overseas for the NASA Station Directors’ conference when he was asked to extend the trip and visit the Goddard Space Flight Centre near Washington D.C. to talk about access fees for Landsat data and then go to the Landsat station in Canada to talk about what was needed to set up a Landsat station. During the course of this trip he found out that Honeysuckle Creek was to be closed and decommissioned in 1981. When he returned from his trip he “volunteered” to start setting up the Australian Landsat Station. This was partly because he was going to need a new job and partly because it sounded interesting. As the project progressed Don became even more fascinated by the potential of the Landsat data and the challenge of building and running data reception and processing facilities.
Industry and Professional Associations
By the mid-1970s, expertise in remote sensing was becoming a recognisable field in its own right. This led to the Remote Sensing Association of Australia being formed in 1976. The initial headquarters for the association were at Technical and Field Surveys’ offices in Crows Nest. It was a group that drew people from industry, government and academia. After a number of years a similarity of interests led to the association combining with the photogrammetric sector to become the Remote Sensing and Photogrammetry Association of Australasia (RS&PAA).
As industry involvement in remote sensing continued to expand steadily there was a need for a channel for formal industry representation in the decision-making and policy arenas. In 1977 the industry user committee for remote sensing, INDUSAT was established. Once again Technical and Field Surveys played an important role, both in establishing the committee and by acting as the secretariat for it. The main aims of INDUSAT were to:
· promote the industrial use of remote sensing;
· encourage government to recognise industry’s needs from remote sensing; and
· lobby for a local data reception facility.
There were about 40 companies represented on INDUSAT, the majority of which were from the mining sector with most of the major mining companies participating, and some agribusiness organisations. Several government departments were involved with the committee as observers.
Designing the Australian Landsat Station
With Don Gray formally appointed as the Director of the ALS in February 1979, the design work started in earnest. Don and a colleague, Frank Northey, set off overseas on a detailed fact-finding tour. They went and talked to staff at several different Landsat ground stations, including the one in Brazil and both of those in Canada. Another important visit was to the EROS Data Centre. At each site they were interested in what data reception and processing facilities they had, why that configuration had been chosen and any problems to be avoided along the way. Since the French space agency, the Centre National d'Etudes Spatiales (CNES) was in the throes of designing facilities connected with its planned satellite series, System pour l’Observation de la Terre (SPOT), Don and Frank also visited France to discuss this design process with the staff of CNES.
At the end of their overseas tour, they had gathered plenty of information and heard many opinions about what the specifications needed to cover and the best design for a Landsat ground station.
There was still one problem, in Don’s words:
Frank and I would have no trouble building a tracking station, antennas and receivers and all that stuff, we knew all about that, but what did you do with the data? How did you process it? [Interview, 12 December 2001].
This was where Ken McCracken helped out by arranging for Andy Green to come and work on the detailed specifications for the image processing.
At the time the specifications for the ALS were being drawn up, there were two instruments on the Landsat satellites. When Landsat-1 was launched, the RBV was considered the main instrument, with the MSS providing supplementary data. During the satellite’s first year of operation there were electrical malfunctions and a need for reducing power use which led to the three RBVs and one of the tape recorders being shut down. This left the MSS as the only instrument on board. Over time, the usefulness of MSS data came to be more and more appreciated.
The final budget for the ALS would only stretch to reception and processing equipment for one instrument. Given the problems with the RBV, the MSS was selected. In this at least, the delay in approving funds for the ALS actually worked in Australia’s favour. Brazil had chosen to install all the equipment for the RBV, which meant that they were up for some very expensive equipment replacement soon after their ground station opened.
As time passed the choice of the MSS proved to be a good one, as this instrument was included on Landsat-3, 4, and 5 whereas the RBV changed format for Landsat-3 and was not included on the satellites after that. With MSS data from Landsat 5 available up to the middle of 2001, there is almost 30 years of data available for analysis. Direct acquisition of MSS data for Australia ceased in November 1997.
One of the biggest inhibitors to the uptake of Landsat technology, all over the world, not just in Australia, was the limited knowledge on the part of potential users of what was available. The US-developed cataloguing system was considered difficult to use and gave potential users no information about cloud cover on the day in question for the scenes they were interested in. This could lead to great frustration, as cloud in the wrong part of a scene could render it useless.
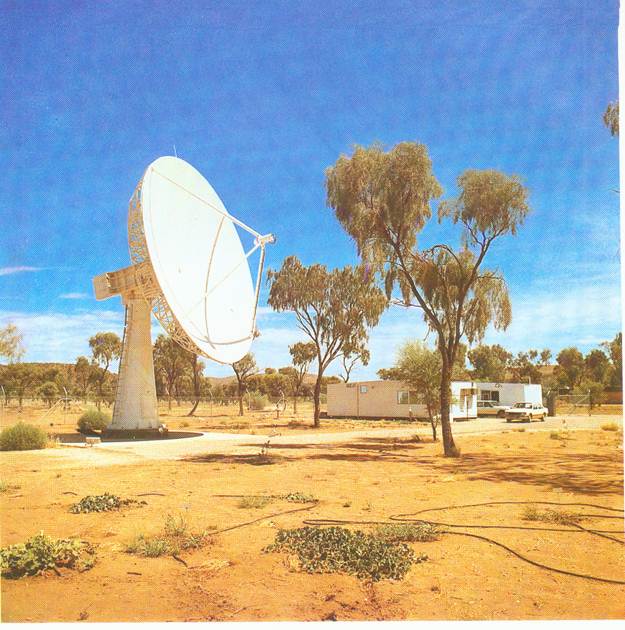
Figure 6: The ALS Ground Station Near Alice Springs
(Satellite Images of Australia)
Together with Allan Falconer from the University of Queensland Geography Department, Don Gray developed an image-based catalogue that allowed users to see miniatures of each scene that was available. Scenes were catalogued using a combination of path and row identifiers, date of collection and 1:250 000 sheet zones. The catalogue was produced primarily as colour microfiche, with a printed catalogue available on subscription. This system eventually became the world standard.
There was some debate about who should act as distributors for Australian Landsat data around the country. The Lands Departments in the various states turned out to be a very good first choice, as they had offices in all state capitals and the expertise to help users select the scenes that would be useful to them. A colour microfiche viewer was bought and installed in each state office so that the catalogue could be viewed.
Further work on Image Processing
In the mid- to late 1970s another group within CSIRO began working on image analysis and display. The Image Systems Group, headed by John O’Callaghan, was based in the Division of Computing Research at the Black Mountain site in Canberra. Unlike the group in the Division of Mineral Physics, who built their own hardware, the Image Systems Group worked with off-the-shelf hardware and wrote the image processing and display software. The initial mage processing was done on the Division of Computing Research’s Control Data mainframe computer using software called CSIRO-ORSER which was a variant of the original ORSER package developed at Penn State University by Brian Turner, an Australian, now at ANU. ORSER was the Office of Remote Sensing and Earth Resources.
The image display system, called a Comtal, was the size of a desk, with all the electronics in a sliding drawer under the desktop. The display itself was a colour monitor sitting on top, and it had a resolution of 512 x 512 pixels, each pixel could display 8 levels each of red, green and blue, giving the equivalent of the modern “millions of colours”. The display unit cost more than $100 000 at the time. A colour monitor on an ordinary desktop computer in 2002 would have a resolution of up to 1280 x 1024 pixels, display the same number of colours and cost under $1000. Although the system was expensive, the alternative displays were the equally expensive output to film, or cheap but very crude character overprint approximations on a line printer.
Specific software had to be written to link the results of the image processing with the display unit. This came to be known as DISIMP, Device Independent System for IMage Processing. The software was run on a dedicated PDP-11 linked to the Comtal. The separation of image processing from image display meant that users could run their analysis on the mainframe remotely and then come to Canberra for a more interactive session using DISIMP and the Comtal. As with other successful CSIRO-written software, DISIMP was eventually commercialised and marketed by Clough Engineering Limited.
Advisory Committees
With the opening of the ALS due in the last quarter of 1979, the advisory committee structure was revised and expanded from just ACERTS, the initial inter-departmental committee that was the NASA principal investigator for Landsat data. ACERTS itself was moved from its home in the BMR to the Department of Science and then effectively replaced by a new committee, the Commonwealth User Committee on Remote Sensing (CUCRS).
A new committee was formed to be the principal advisory body for remote sensing in Australia, the Australian Liaison Committee on remote sensing by satellite (ALCORSS). The first interim meeting was in March 1979, with formal meetings starting in 1980. Membership of ALCORSS consisted of representatives from each state, the Commonwealth, private industry and tertiary education. It provided a forum to promote the efficient and effective use of remote sensing in Australia.
The structure of ALCORSS and the methods for appointing members meant that there were direct links back to remote sensing interests represented. Most members were part of other remote sensing committees:
· The Commonwealth departments were represented by a member of CUCRS;
· The CSIRO was represented by the Chief of the Division of Mineral Physics;
· The State representatives were Ministerial appointees who were also responsible for co-ordinating remote sensing issues through their local committees;
· Private Industry was represented by the chair of INDUSAT; and
· Universities and Colleges of Advanced Education were represented by appointees of the Australian Vice Chancellors’ Committee and the then Australian Committee of Directors and Principals in Advanced Education respectively.
Although administrative and support services for ALCORSS were provided by the Commonwealth government through the ALS, members met all their own participation costs.
The First Australasian Remote Sensing Conference: Landsat ’79
In May 1979, Sydney was the venue for the first Australasian Remote Sensing Conference, Landsat ’79. It was the first major national remote sensing gathering held in Australia. Over 410 delegates, from a wide range of disciplines, attended the four-day conference. Fifty papers were presented in addition to five plenary sessions featuring experts from the United States who provided overviews of Landsat developments and applications in their fields.
The papers were divided into five thematic groups:
· Agriculture, land use, forestry;
· Geology and mineral exploration;
· Mapping;
· Techniques development and image processing; and
· Water resources.
Looking through the conference proceedings gives a feel for the amazing expansion in the range and sophistication of the applications of satellite data. A paper by Mike Aubrey of Technical and Field Surveys provided an overview of Landsat applications in Australia, focussing on geological uses but covering other disciplines.
The variety of case histories presented in this symposium will more than adequately illustrate the specific applications of Landsat in Australia [Michael C. Aubrey, The Applications of Landsat in Australia with Particular Reference to Geology — an Overview , Proceedings, Landsat ’79, Sydney, Australia May 1979].
In geology the most common use for Landsat data was for structural interpretation and lineament analysis. With the introduction of digital analysis the data was also used for rapidly searching areas for specific indicators for various types of mineral formations. Oil companies were using mosaics of Landsat images to identify large scale structural patterns while digital image analysis was being used for detailed studies of the geology of exploration permit-sized areas.
The Division of National Mapping and the Naval Hydrographer’s Office had used Landsat images to support planimetric and hydrographic mapping. National Mapping was also working on 1:1 000 000 and 1:5 000 000 scale land use maps.
In the area of land use, the CSIRO Division of Land Resource Management produced maps of forest conditions and investigated methods of identifying specific pasture species and noxious weeds from their appearance in the Landsat data. In the CSIRO Division of Land Use Research a preliminary regional land use study for the whole of South Australia was completed in just 15 months.
1979 also saw the first use of satellite data in an Australian court of law. During a heavy rain storm an irrigation channel in Northern Victoria burst and a woman was drowned. The subsequent liability case rested on whether the excess water in the irrigation channel came from the river, in which case the Victorian Rivers Commission was guilty of negligence, or whether it came from general run-off. Don Currey of the Victorian State Rivers Commission realised that, if he was quick and the timing was right, Landsat images could settle the question. He contacted NASA and arranged to get the appropriate scene sent out. Luckily the weather had cleared so there was little cloud over the area of interest and the imaging schedule meant there was a scene available from only a couple of days after the flood. Analysis of the image showed that the flood water was highly turbid, that is full of sediment, rather than clear, indicating that it came from run-off, not the river. The case was settled out of court without coming to trial.
In the area of law enforcement, satellite images held by the CSIRO Division of Mineral Physics were used during two royal commissions in the very late 1970s to help identify and locate marijuana crops.
Building and Commissioning the ALS
One of the first issues to be settled was that of a site for the ground station and antenna for the ALS, otherwise called the Data Transfer Facility (DTF) or Data Acquisition Facility (DAF). Looking at a map of Australia, it was clear that somewhere close to the geographic centre would be ideal as it would allow coverage of the whole continent as well a good proportion of Papua New Guinea. As it happened, CSIRO had some land in an ideal spot eight kilometres outside Alice Springs. This site effectively chose itself as it allowed the desired coverage as well as being near reasonable transport, accommodation, communication and civic amenities.
When it opened, the ground station consisted of two transportable buildings for staff and equipment and a 9.14m tracking antenna. There were five technical staff and one part-time clerical person to run the operation. The administration was done from some rented space in a CSIRO building only about 100m from the ground station compound.
When it came to the Data Processing Centre, which was to be made up of digital, photographic and user services sections, there was enormous debate about where it should be. Although some people thought that it should be in the same place as the ground station, Don Gray was insistent that it be somewhere both physically accessible to users and where it would be reasonably easy to attract and retain staff for such a high-tech facility. Having worked at the Woomera range for three years in the 1960s, he was well aware of the potential difficulties of recruiting and retaining such staff in a remote location. He thought that Alice Springs, like Woomera, would be an expensive and difficult place to run that type of operation. Canberra was eventually chosen as it is close to the demographic centre of Australia and had a high proportion of the type of people the Data Processing Centre would need to employ. This was a critically important decision.
The first premises for the Data Processing Centre were in an old discount warehouse in Oatley Court, Belconnen, an area dominated by car yards and hardware shops near one on Canberra’s newest shopping malls. Although the building was not particularly old, the roof leaked in places and the air conditioning was very patchy.
The cost of establishing the ALS was about $4.5million, of which $600 000 was for the photo lab alone. At first about 90% of the data distributed was in the form of photographic images and 10% digital. This explains the need for such a massive investment in photo processing.
Landsat stations around the world had by this time found out that the only way to ensure consistently high quality image production was to process the film in-house. Don sent some samples to commercial processing outlets to test the situation in Australia but the results were too inconsistent for this to be a sensible long term option.
Finding staff for the two sites was an interesting challenge. The engineering staff were recruited from the tracking stations near Canberra, the Chief Engineer came from Honeysuckle Creek and the Digital Engineer came from Tidbinbilla. The photographic staff were recruited from the Australian Air Force, Navy, the BMR and a holiday photo lab.
The processing of images from satellites proved to be an interesting experience for both Don Gray and the photographic staff. An early problem was, ironically enough, with the perfectionist approach of the photo technicians to the images. As Don recalls:
They’d find a line somewhere in the imagery and they’d say “That can’t be there” and they’d wave these little sticks over it while it was damp. And what they’d tried to cut out was that crossing, Cameron’s Corner where you can see three state borders on the images quite distinctly. And they were trying to wave these things out “’cause you couldn’t possibly see a fence from space!”. Not at MSS data levels. Someone had made these funny marks on the image. So we had to educate them to some extent to accept that what appeared in the data was meant to be in the data. But by the same token, they knew what colours ought to be like and how they would come out, particularly the false colour stuff [Interview, 12 December 2001].
As Don had predicted, staffing the ground station in Alice Springs was much like staffing the Woomera rocket range. There seemed to be two extremes: people who came to the facility, hated it and left within a few months, and those who fell in love with the location, work and lifestyle and stayed for most of their working life.
The supply of satellite data from NASA to the ALS was negotiated at an initial cost of $US200 000 per year, the standard cost for non-American ground stations.
The ALS began operation with partial coverage of Australia in October 1979 and provided full coverage of the area within its receiving circle from December of that year onwards.
The Growth of Education and Training in Australia
As remote sensing became more and more widely used, the demand for education and training increased. The Australian Mineral Foundation short courses continued to be popular. In 1976 Technical and Field Surveys began to run a regular short course program in remote sensing for industry, government, defence and academic personnel. What was still lacking was a drawing together of academic interest in remote sensing and a formal degree program in the discipline.
This changed in 1980 when the University of New South Wales received almost simultaneous suggestions for the establishment of a remote sensing group from two different academics. The submissions were made by Bruce Forster of the Department of Photogrammetry in the School of Surveying and John Richards of the School of Electrical Engineering. Both had recently completed sabbaticals overseas that focussed on remote sensing techniques.
Bruce Forster took his sabbatical from December 1978 to June 1979 and divided his time between the University of Aston, Birmingham, England and the University of California, Santa Barbara, California. His principal interest was the application of remote sensing to urban areas. John Richards’ sabbatical went from late July 1979 to early February 1980. It was mostly spent at the Laboratory for Applications of Remote Sensing at Purdue University, Indiana looking at the development and use of pattern recognition technologies as they applied to remote sensing. Both met the people with whom they took their sabbaticals at a workshop held at the CSIRO Headquarters in Canberra in late 1978.
The two submissions were effectively combined and a formal joint proposal for a Centre for Remote Sensing put together. The proposal was widely circulated, within the university and also to industry and CSIRO to gauge the likely level of support. The University of New South Wales Centre for Remote Sensing was formally launched in October 1981, with John Richards as the founding director. The Centre started teaching at the beginning of the 1982 academic year with ten postgraduate students and is still operating at the time of writing.
A survey of tertiary education remote sensing in Australia carried out in 1983 shows how quickly this sector of tertiary education was growing. In addition to the large number of subjects in various degrees which were either partly or wholly concerned with remote sensing, there were four institutions offering (or about to offer) postgraduate programs in remote sensing. There were 16 university departments offering research degrees, with 15 PhD and Masters students enrolled at the time of the survey. By the time a follow-up survey was conducted in 1988-89, the number of subjects concerned with remote sensing had gone up two and a half times. The postgraduate research population had increased to 16 institutions, 22 departments and 36 PhD and Masters students.
Landsat Program Administration
On January 6 1978, Landsat-1 was finally decommissioned. It had been in service for six years, five more than its initial design life of one year. A couple of months later the third satellite in the family, Landsat-3, was launched on 5 March 1978. The plan was to always have an overlap in the operations of successive satellites in case of problems with the launch or onboard equipment.
In November 1979, the continuing debate about whether the Landsat program was developmental or operational took a more decisive turn. The Carter administration in the United States issued Presidential Directive 54 which had three main parts:
· Landsat operations were transferred from NASA to NOAA;
· It recommended that a long term operational system of earth-observing satellite system be developed, with an additional four satellites beyond Landsat-3;
· It recommended that Landsat operations should be transferred to the private sector.
This marked the beginning of the efforts to commercialise the Landsat program, Full development of a commercial market for Landsat data was expected to take at least a decade.
The Early Operations of the Australian Landsat Station
The arguments advanced to secure funding for the ALS relied heavily on establishing the need for such a facility. It had taken a lot of co-ordinated lobbying to convince ASTEC that there was enough demand for Landsat images and digital data to make the investment worthwhile.
As it happened, the ALS uncovered a much larger, and hence largely unanticipated demand for Landsat imagery. Within three months of the station opening there was a six month backlog of requests. This lead to an extension of operating hours by the addition of an evening and a midnight shift, and a tripling of the front-line staff working on requests and processing photographs. There had to be a full cabinet submission to get an extra $35 000 to pay the bills for the extra work.
Not surprisingly, when the ALS started distributing data, about 60% was used for mining and mineral exploration applications. The rest was mainly agricultural and water management use, with a few dabblers and experimenters making up the balance.
As the cost of computing fell throughout the 1980s, many more people started doing their own customised digital processing. This did not stop the demand for high-quality images, and the production of photographs for clients remained a key element of the ALS’ core business.
The steady rise in the use of small, desk-top computers led to a new market for data processing software that automated many standard procedures. While initially anyone who did their own data processing wrote their own programs from scratch, there arose a large new class of users who wanted processing software they could easily use.
A particularly successful example of this type of software was BRIAN (Barrier Reef Image Analysis), a powerful and inexpensive software system for processing satellite and other remotely sensed data. It was initially developed as a shallow water image analysis system to map the entire Barrier Reef. The original image analysis system was written by David Jupp and his associates at two CSIRO divisions, Water Resources and Wildlife and Ecology, together with the Australian Survey Office and the Great Barrier Reef Marine Park Authority. The software was redeveloped and commercialised as microBRIAN in a joint venture between the CSIRO and MPA Communications Pty Ltd in 1986,
The Landsat satellites were not the only ones providing data for Australian applications. In the late 1970s a new instrument, the Advanced Very High Resolution Radiometer (AVHRR), was launched on NOAA Television Infra-red Observation Satellite (TIROS) satellites. Its spectral coverage was relatively simple, designed to distinguish between land, water, cloud and ice, but had the enormous advantage for observers of vegetation that its orbit allowed for new images every day. Although both spatial and spectral resolution was comparatively low, the update frequency meant that the functioning of landscapes could be studied in far more detail than was previously possible.
In the early 1980s, Landsat imagery again made an appearance in an Australian court of law. The South Australian Government had sued the New South Wales Government over water levels in the Darling River. Their complaint was that New South Wales was issuing too many water permits for irrigating cotton in the Bourke/Brewarrina district and thus allowing too much water to be taken out of the Darling River. Since the amount of water used by a crop is closely related to the area of that crop, the case hinged upon having an independent assessment of how many acres of irrigated cotton there were in the district in question. The Centre for Remote Sensing at UNSW used detailed analysis of satellite imagery to determine the area of irrigated cotton. The analysis showed that the irrigated area was no more than it should have been, demonstrating that the right number of water permits had been issued. The court case was dropped.
Changes in the Landsat Program
In 1981 the Reagan administration in the United States accelerated the pace of Landsat commercialisation. While it maintained the Landsat program’s status as “operational”, it rejected the previous government’s commitment to a gradual transition to the private sector and instead advocated an immediate end to government funding for the program. This was to have a major impact worldwide on data cost and access.
Four years after the launch of Landsat-3, Landsat-2 was decommissioned on 26 February 1982, leaving just one satellite in the family in orbit.
On 17 July 1984 the Land Remote-Sensing Commercialisation Act Of 1984 (PL 98-365) came into law in the United States. It established the process for commercialisation of the land remote sensing satellites in several ways, it:
· was the instrument for commercialisation of Landsat system through contract with NOAA;
· allowed the Department of Commerce to license private remote sensing space systems that complied with the Act ; and
· stipulated that Landsat data must be made available on a non-discriminatory basis, with the Department of Commerce required to maintain archive of land remote sensing data.
One of the major effects of this was to triple the cost of data supply to the Australian Landsat Station.
Despite the changes to the way the Landsat program was administered, technical advances and the launch of new satellites continued.
On July 16 1982, Landsat-4 was launched still with the MSS but with a new instrument, the Thematic Mapper (TM) replacing the RBV. The TM, like the MSS was a mechanical scanning device, but with seven spectral bands instead of four (five on Landsat-3) and a ground resolution of 30m x 30m for all but the thermal band which was 120m x 120m. The spectral bands were: red, green, blue, near infrared, two mid-infrared and thermal. The second mid-infrared band was added late in the design process at the request of the geological community. The TM used a different transmission frequency and data format to the MSS. Another difference was that Landsat-4 was in a lower orbit than its predecessors, 705km as opposed to 920km.
The difference in transmission frequency between the TM and the MSS posed a serious problem for Australia because the ALS ground station in Alice Springs was only designed to receive the S-band transmissions from the MSS. In other words, it could not receive the higher frequency X-band used by the TM. Because Landsat-4 had both instruments on board, this was frustrating, but not yet a disaster, as at least the MSS data could be received. The real crisis would arise when Landsat-4 was decommissioned, as it was to be the last satellite equipped with the MSS.
Although most of the Landsat satellites so far had exceeded their design life, it was clear that Landsat-4 could not be expected to last forever. This meant that, unless there were changes to the equipment of the ALS, both at the antenna site in Alice Springs and the data processing site in Canberra, there would be no Landsat data reception in Australia once it reached the end of its working life. This potential loss of Landsat data led to two attempts by the ALS during 1982 and 1983 to get funding for an upgrade to their data reception and decoding facilities. Sadly neither attempt to gain funding was successful.
While the problems with Landsat data were looming large, other data sources continued to be used. Although simple, AVHRR images continued to be useful for monitoring changes in the landscape. Using them it was possible to detect both the severe drought in the summer of 1982-3 and the devastating Ash Wednesday bushfires in February 1983.
The TM Signal Processing Experiment
On March 11 1983 Landsat-3 was decommissioned, leaving just Landsat-4 to provide data with no back-up.
In response to this, Ken McCracken proposed to CSIRO and the ALS that an experimental upgrade of the facilities be performed to demonstrate that there was a technical solution to the data transmission problems and that the TM data was valuable in its own right. CSIRO agreed to provide $200 000, which was 25% of the funds needed if Ken could raise the rest. Ken established a group of 25 interested parties, or shareholders who, between them, came up with the money. Many of the shareholders were from the mining industry, who were finding themselves seriously disadvantaged by their lack of access to the new data. Kerry O’Sullivan of CRA was a major player in this. AMIRA, the Australian Mineral Industry Research Association was a key sponsor of this work.
The project became known as the Thematic Mapper Signal Processing Experiment. Three CSIRO Divisions were involved in the TM Signal Processing Experiment: Mineral Physics, Radiophysics and Computing Research.
Great care was taken to emphasise the experimental nature of the work, so as not to pre-empt the official upgrade of the facilities that was being lobbied for so hard. As a contemporary document put it:
“The ALS/CSIRO Signal Processing Experiment is designed to acquire experimental quantities of TM data and to develop the geometric and radiometric correction and enhancement techniques necessary for the next generation of user products.
This is a sponsored research project under the auspices of the Australian Minerals Industry Research Association, CSIRO and the Division of National Mapping.
It is emphasised that this experiment is not intended to provide an operational service. It is designed to provide experimental quantities of TM data from representative areas for evaluation as early as possible ahead of an operational upgrade of the Australian Landsat Station. Such an upgrade is at least two years away from completion” [Unknown, (1986?), ALS/CSIRO TM Signal Processing Experiment].
Even from looking at the specifications it seemed clear that there would be value in the TM data. Being of much higher resolution than the MSS data it was of far more use to people interested in mapping applications.
The main design for the Signal Processing Experiment was done by Andy Green and Guy Roberts from CSIRO Mineral Physics, with CSIRO Radiophysics contributing the additions to the antenna at the ground station in Alice Springs. A third CSIRO Division, Computing Research, also contributed resources to the experiment.
The base criteria for the project were that it be cheap, quick and not interfere in any way with the normal MSS operations at either the ground station at Alice Springs or the data processing centre in Canberra. As it was only intended as an experimental program, fully engineered sub-systems were not required, although reliability remained an important consideration due to the remoteness of Alice Springs. The lifetime of the experiment was expected to be about two years, as a complete operational upgrade to receive Landsat-5 TM and other remote sensing satellite data, such as SPOT was not expected within that time.
There were two parts to the Signal Processing Experiment: upgrading the ground station in Alice Springs to receive transmissions at the new frequency; and developing the data processing techniques required for the new data format.
The ground station required significant changes before it could receive the new X-band signals. The changes included installation of modifications to the antenna, a high speed digital data frame synchronizer, and new data recorders.
The researchers decided to use TM data from Landsat-5 for the experiment. The first reception of Landsat 5 was in 1986, just one week after the government had announced the commitment of funds for the official upgrade of the ALS. It took nearly another three years before the full upgrade was complete. For that period, Australian users of TM data were totally dependent upon the Signal Processing Experiment.
The work of Ken McCracken, Andy Green and Jon Huntington in the AMIRA research program and on the Signal Processing Experiment was recognised by their being awarded the Australia Prize in 1995.
Three scientists who have used satellite images to revolutionise the search for minerals in Australia's deeply weathered landscapes, and an engineer whose instruments have brought new precision to weather forecasting, are joint winners of the 1995 Australia Prize. Dr Ken McCracken, founding chief of CSIRO's Division of Mineral Physics, and his colleagues, Dr Andrew Green and Dr Jonathan Huntington, of CSIRO's Division of Exploration and Mining, share the award with Dr Richard Moore, Emeritus Professor of Electrical and Computer Engineering at the University of Kansas, USA [Department of Science announcement of 1995 Australia Prize].
In March of 1984 the ALS was transferred from the Space Projects Branch of Department of Science and Technology to the control of the Division of National Mapping in the Department of Resources and Energy. In the long run this proved beneficial as National Mapping was in a better negotiating position for securing funds. This was partly because it was much more closely associated with the mining industry, still one of the major users of satellite data. Initially the movement of the ALS between departments caused delays as there was a serious loss of management continuity and understanding of its role and value. Effectively the lobbying for funds for the TM upgrade had to be restarted in the new department.
As remote sensing moved steadily from being an experimental tool to a standard part of many government and commercial operations, the ways in which information was exchanged began to change.
In the mid-1980s satellite operators started introducing confidentiality requirements into their agreements with ground stations all over the world. The effect in Australia was to greatly reduce the ability of the ALS to co-operate with industry.
Mining companies had seen the commercial value of remote sensing very early and this was reflected in their approach to collaboration. They were usually quite happy to exchange information about the techniques they were developing, but very reluctant to talk about which data they were looking at. This meant that, as a rule, a mining company never bought data for just one scene, instead they selected a range so that even the ALS couldn’t know what, or more particularly where, they were really interested in.
As the cost of computing power came down, more and more organisations started doing their own digital processing. Despite this, at the end of the day, most people still wanted to see a picture. There was still a lack of facilities for producing images of the required quality, so the ALS started making time in its photographic lab to produce high-quality images of the results of other organisations’ digital processing. The increased commercial sensitivity of the images meant that the ALS also had to promise not to show the images to anyone. This work grew to become a substantial part of ACRES business and to some extent filled the gap in the work of the photographic lab caused by the increase in the proportion of data supplied digitally. As time passed and the cost of high-quality colour display and printing also began to fall the workload of the photographic lab began to tail off. The last photo technician retired on 13 December 2001.
Lobbying for the ALS Upgrade
It was extremely difficult to get the money to upgrade the ALS. One reason given was that the ALS was defined as “not meeting costs”, causing some people in government circles to question the merit of putting even more public money into it.
There were good reasons for this apparent shortfall in income, of which two major ones were outside the control of ALS management. As a government body, the ALS wasn’t set up to make a profit. Under the terms of the initial cabinet decision to establish the ALS the price structure was set to ensure that it covered its running costs. A later change in government accounting meant that depreciation of capital equipment and facilities were added to the cost calculations. Given the capital cost of the ALS, this made a significant difference to how much it was deemed to cost to run the operation.
The second change was in the cost of data. Originally the Landsat data supplied by NASA cost US$200 000 per year. When management of the Landsat program was moved from NASA to NOAA in 1979 this was raised to US$600 000 per year.
Despite the increase in the cost of data the ALS continued to cover its running costs but could not stretch to covering the depreciation as well.
While there was this resistance on the part of government to committing more money to the ALS, there were no such doubts on the part of industry. Among the groups agitating for the ALS to be upgraded was INDUSAT which commissioned a major report into the benefits of the upgrade and the need for Australian industry to have access to the TM data.
Remote Sensing and Australian Space Policy
In the mid-1980s Australia started to look at developing an integrated national space strategy to take it into the next two decades. A major review of Australia’s involvement in space that recommended a strategy for the future, A Space Policy for Australia, otherwise known as the Madigan Report was published in 1985. Remote sensing was considered to be the main thrust of this strategy. As a result of this report, the Australian Space Board and the Australian Space Office were established in 1986. The slogan for the latter was Making Space for Australia.
The Australian Space Board established a Remote Sensing Working Group to develop a formal policy for the development of the field in Australia. The working group was chaired by Graham Lindsay, later Commonwealth Surveyor General and General Manager of AUSLIG.
The development of the policy was contracted to Technical and Field Surveys and the resulting remote sensing industry strategy and action plan was presented to the Australian Space Board under the heading Sensing Opportunities for Australia in July 1989. The document was formally adopted as policy by the Australian Space Board, and a Remote Sensing Committee was established to put the policy into practice. The committee was chaired by Ken McCracken who was by this time heading up the CSIRO Office of Space Science and Applications (COSSA). The Remote Sensing Committee was in charge of approving government funding for major remote sensing projects.
New Satellites and New Data Sources
A new remote sensing satellite had been launched by the French Space Agency. CNES on February 22 1986. It was called SPOT, which stood for System Pour l’Observation de la Terre. It carried a pair of identical High Resolution Visible (HRV) scanners which had two modes of operation: a multispectral mode which had a resolution of 20m x 20m and a monochromatic mode which had a resolution of 10m x 10m. In the multi-spectral mode the bands recorded were: green, red and near infrared. Each scene was about 117km across, smaller than those of the MSS. At 26 days, the repeat cycle was fairly long. Australian researchers were very keen to have access to this new, high-resolution data.
During the negotiations there was a long debate about what the agreement for the purchase and distribution of SPOT images between CNES and the ALS should be called. “Treaty” was unsuitable, because treaties are between countries and “contract” was also inappropriate, because a government body, that is the ALS, could not be contracted to a private organisation. This hitch in finding the appropriate terminology led to some comical interludes. At one point Don Gray suggested that the term “arrangement” might be suitable. He was puzzled by the somewhat frosty response he got from a senior female negotiator until another member of the French delegation took him aside and explained: “An arrangement is what you have with your mistress”. The term was not used. Eventually both the terminology and price were settled and the ALS was able to start distributing images and data.
The change to receiving and distributing data from two different satellite families meant that the name Australian Landsat Station was no longer appropriate and in October 1986 the name was changed to Australian Centre for Remote Sensing (ACRES).
ACRES was not the only distributor of SPOT data. In 1987 Technical and Field Surveys entered into a joint venture arrangement which saw them distributing data from the SPOT family. This was later incorporated as SPOT Imaging Services.
Completion of the ALS Upgrade
The $15 million funding required for the upgrade of ACRES facilities to receive TM data was finally allocated in the Federal Budget of 1986. By this time there were other satellites with instruments which also used X-band for transmissions and the plans for the upgrade were amended to include the ability to receive data from these satellites as well
The work done on the TM Signal Processing Experiment meant that work on the upgrade could start quickly, as many of the technical issues had been resolved. The upgrade was at last completed in 1988, six years after the launch of the first satellite carrying the TM equipment.
The upgrade of the ALS to enable it to receive the X-band transmission of the Thematic Mapper as well as data from the French SPOT satellites ended up costing $15m, three times what it had cost to establish the station in the first place.
As expected, the higher resolution of TM and SPOT data made it of great use to those using it for mapping applications. While it was not used much for map compilation, it was very valuable for revision work. This led to an upsurge in the use of satellite data by the mapping community.
1988 saw another administrative change for ACRES when it left the Department of Minerals and Energy to become part of the Australian Surveying and Land Information Group (AUSLIG) within the Department of Administrative Services. AUSLIG had just been formed by the merger of the Division of National Mapping and the Australian Survey Office. Keeping ACRES with areas devoted to surveying and mapping was seen as maintaining its links with its core business of the time.
Conclusion
The completion of the ALS/ACRES upgrade saw the beginning of a new era in remote sensing. The facilities had gone from receiving data for just one type of instrument on just one satellite to being able to pick up several instruments on several different satellites. This expansion was set to continue as new satellites, with a wide variety of instruments on board, were being launched by many different countries. There was also a move towards far more private sector involvement in running satellites and image distribution.
As well as a great expansion in the range of available data, the cost of computing was falling dramatically so that it was now possible to have as much power on the desktop as had filled a room ten years previously. This led to a massive proliferation of organisations becoming involved in data processing and analysis, and the development of many small niche markets, a far cry from the mid-1970s when there were just six large organisations in Australia with the necessary resources.
Remote sensing in Australia suffered something of an identity crisis over the years, at least in government circles. Despite remaining essentially an autonomous unit, the moves of ACRES between departments in part reflected this as the question of whether remote sensing was primarily a mapping tool, primarily part of Australia’s mineral industry or part of an overall space program continued to be debated.
This last question was one of the most problematic. When space involvement was near the top of the political, and hence funding priority list, there were great advantages in being seen as part of a national space program. Unfortunately, when priorities changed, everything to do with “space” tended to be perceived as being expensive, sometimes stupidly expensive. Deciding where to position ACRES in this climate was never easy.
Despite this philosophical and practical problem, remote sensing continued to flourish. The advent of sophisticated but small-scale desktop Geographic Information Systems (GIS) led to an even greater integration of satellite data with other sources of information about the land and its resources. The next ten years would see many challenges, some triumphs and the occasional failure for remote sensing in Australia.
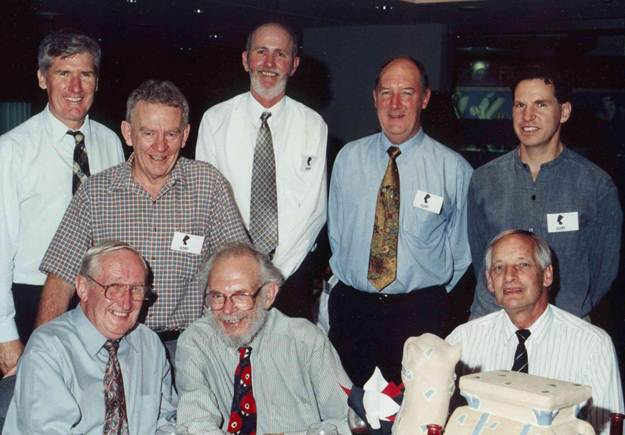
Figure 7: Remote Sensing Pioneers and Some of Their Successors
Back row: Ian Sheppard, Peter Holland, John Richards, Paul
Tresize
Middle: Carl McMaster
Front row: Don Gray, Ken McCracken, Colin Simpson
Glossary of Terms and Acronyms
|
ACERTS |
Australian Committee for (the) Earth Resources Technology Satellite |
|
ACRES |
Australian Centre for Remote Sensing |
|
ALCORSS |
Australian Liaison Committee on Remote Sensing by Satellite |
|
ALS |
Australian Landsat Station (later ACRES) |
|
AMF |
Australian Mineral Foundation. |
|
AMIRA |
Australian Mining Industry Research Association |
|
ASTEC |
Australian Science, Technology and Engineering Council. |
|
AUSLIG |
Australian Surveying and Land Information Group. |
|
AVHRR |
Advanced Very High resolution Radiometer |
|
BMR |
Bureau of Mineral Resources, Geology and Geophysics (later AGSO, then GeoScience Australia) |
|
CNES |
Centre National d’Etudes Spatiales (French Space Agency) |
|
CSIRO |
Commonwealth Scientific and Industrial Research Organisation |
|
CUCRS |
Commonwealth User Committee on Remote Sensing |
|
DAF |
Data Acquisition Facility. The ALS ground station near Alice Springs where the antenna and associated recording and storage equipment were housed. Also called the Data Transfer Facility (DTF) |
|
DTF |
See DAF. |
|
EROS |
Earth Resources Observation Systems data centre for the US Geological Survey and supplier of Landsat images. |
|
ERTS |
Earth Resources Technology Satellite (original name of Landsat satellite family) |
|
HRV |
High Resolution Visible scanner on SPOT satellites |
|
INDUSAT |
Australian Industry user committee for remote sensing |
|
IREE |
Institution of Radio and Electronics Engineers |
|
MSS |
Multi-spectral Scanner. One of the instruments on the first four Landsat satellites. |
|
NASA |
National Aeronautics and Space Administration Agency (of the United States of America) |
|
NOAA |
National Oceanic and Atmospheric Administration (of the United States of America) |
|
RBV |
Reverse Beam Vidicon. An instrument on the early Landsat satellites. |
|
RS&PAA |
Remote Sensing and Photogrammetry Association of Australasia |
|
SPOT |
System Pour l’Observation de la Terre (French satellite family) |
|
TERSS |
Tasmanian Earth Resources Satellite Station |
|
TFS |
Technical and Field Surveys Pty Ltd. A private company specialising in geological mapping and early GIS which was a very early participant in Australian remote sensing. |
|
TIROS |
Television Infra-red Observation Satellite. Series of meteorological satellites first launched in 1960. |
|
TM |
Thematic Mapper |
|
USGS |
United States Geological Survey |
This narrative forms part of a thesis, by Catherine Rayner, successfully submitted for the Degree of Master of Philosophy of The Australian National University.
This project was completed with the financial assistance of the Australian Surveying and Land Information Group. Commonwealth Department of Industry, Science and Resources. The Commonwealth is not responsible or liable in any way whatsoever for the contents or fitness for purpose of the project outcomes.
Reproduced with permission – copyright conditions apply.